1. Introduction to automotive injury biomec
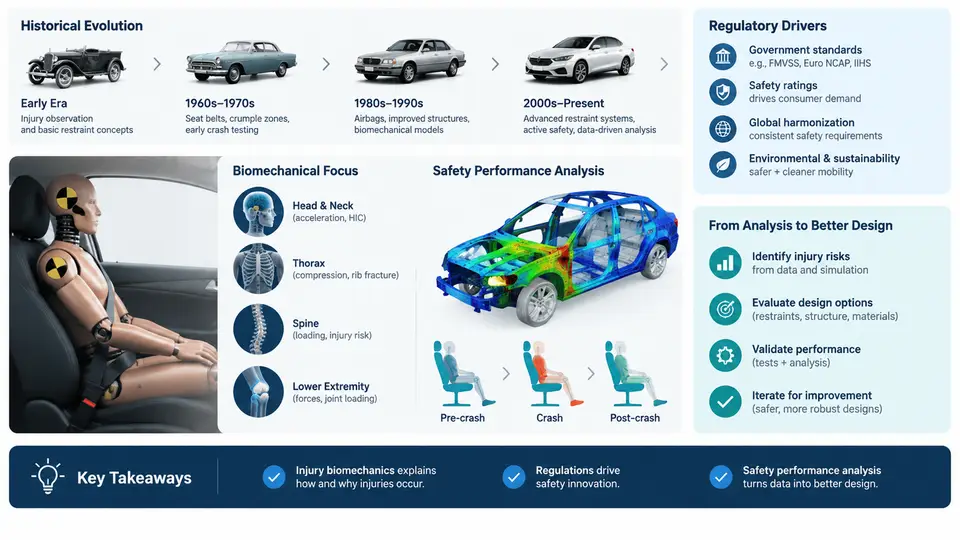
Automotive injury biomechanics is the study of how mechanical forces generated during a collision interact with the human body to produce injury. It sits at the intersection of crash dynamics, human anatomy, materials science, and vehicle structural design. For the safety performance analyst, the discipline answers three practical questions: what loads can human tissue tolerate, how do those loads arise inside a crashing vehicle, and what design changes reduce the probability or severity of injury?
The field is not purely academic. Every airbag deployment threshold, every seatbelt load limiter setting, and every crumple-zone geometry decision ultimately traces back to biomechanical tolerance data and the regulatory or consumer-test targets derived from it. Understanding this lineage is what allows an engineer to interpret a crash test result rather than merely record it.
Historical Evolution
Systematic injury biomechanics began in the 1940s and 1950s, driven initially by military aviation and later by the rapid growth of highway traffic. Early researchers such as John Stapp subjected volunteers and instrumented dummies to controlled decelerations, establishing the first quantitative links between acceleration magnitude, duration, and human tolerance. The Wayne State Tolerance Curve, published in the early 1960s, formalized the idea that the head can withstand high acceleration for very short durations but far less as the pulse lengthens. This duration-dependent tolerance concept remains embedded in modern head injury criteria.
The 1960s and 1970s produced the foundational cadaver and animal studies that defined thoracic and abdominal tolerance, along with the development of the Hybrid II and later Hybrid III anthropomorphic test devices (ATDs). Hybrid III, introduced in the mid-1970s, became the workhorse of frontal impact testing and is still the primary regulated frontal dummy today. Its instrumentation — head accelerometers, neck load cell, chest deflection potentiometer, femur load cells — was designed specifically to measure the physical quantities that biomechanical research had identified as injury predictors.
From the 1990s onward, the field expanded in two directions. First, finite element (FE) human body models (HBMs) such as the Total Human Model for Safety (THUMS) and the Global Human Body Models Consortium (GHBMC) family allowed injury prediction at tissue level rather than through dummy surrogates alone. Second, real-world crash data analysis, using databases like NASS-CDS and later CISS, provided field evidence to validate and refine laboratory criteria. The current era combines ATD testing, HBM simulation, and field data into an integrated safety assessment workflow.
Regulatory and Consumer-Test Drivers
Regulation converts biomechanical knowledge into enforceable requirements. In the United States, FMVSS 208 governs occupant crash protection, specifying frontal barrier tests at 56 km/h (35 mph) with belted and unbelted Hybrid III dummies, and defining pass/fail limits on head injury, chest deflection, and femur loads. FMVSS 214 addresses side impact, while FMVSS 201 covers interior head impact. In Europe, UN Regulation No. 94 and No. 95 play equivalent roles, and the Euro NCAP consumer program pushes beyond minimum legal requirements with offset deformable barrier tests, pole impacts, and whiplash assessments.
Consumer-test programs have become de facto design drivers because OEMs compete on star ratings. A vehicle that merely passes FMVSS 208 may still score poorly in Euro NCAP or IIHS evaluations, particularly in small-overlap frontal crashes and rear-seat occupant protection. The analyst must therefore track multiple target sets simultaneously, each with its own dummy, impact configuration, and injury criteria.
- HIC (Head Injury Criterion): integrates resultant head acceleration over the most critical time window; regulatory limit typically 700 for a 36 ms window in FMVSS 208.
- Nij (Neck Injury Criterion): combines axial force and bending moment to predict neck injury.
- Chest deflection: measured in millimeters; Hybrid III limits are typically 63 mm for the 50th percentile male.
- Femur force: axial compression limit typically 10 kN, associated with fracture risk.
- VC (Viscous Criterion): rate-dependent chest compression used in side impact and advanced frontal assessments.
The Role of Safety Performance Analysis in Vehicle Development
Safety performance analysis is the engineering function that translates these criteria into design decisions throughout the vehicle program. It is not a single activity but a continuous loop spanning concept, detailed design, validation, and production. The analyst works alongside body structure engineers, restraint system suppliers, and CAE teams to ensure that the occupant is protected across the full range of crash modes and occupant sizes.
A typical development sequence proceeds as follows. During the concept phase, the analyst establishes target injury values based on regulatory and consumer-test requirements, then uses simplified lumped-mass or early FE models to set preliminary crush-zone stiffness and restraint packaging envelopes. In detailed design, full-vehicle FE models simulate the barrier tests, and the analyst iterates on structural reinforcements, airbag venting, seatbelt pretensioner timing, and load limiter force levels. Physical prototype tests then validate the CAE predictions, and any discrepancy triggers a correlation study before final calibration.
The following SVG illustrates the closed-loop relationship between biomechanical tolerance data, regulatory targets, CAE simulation, physical testing, and design iteration — the core workflow of safety performance analysis.
The loop is deliberately closed. Field data feeds back into tolerance refinement and target setting, while correlation studies ensure that simulation remains predictive. When a physical test produces a HIC of 850 against a CAE prediction of 620, the analyst does not simply adjust the model to match; the discrepancy is investigated — perhaps the airbag deployment timing was different, or the seatbelt anchor point deflected more than modeled. Only after the root cause is understood is the model updated.
A Worked Example: Frontal Barrier Target Setting
Consider a mid-size sedan program targeting a 5-star Euro NCAP frontal rating. The analyst begins with the Euro NCAP frontal offset test (50 km/h, 50% overlap, deformable barrier) and the mobile progressive deformable barrier test. The target for the 50th percentile male driver is a HIC below 500 and chest deflection below 42 mm, providing margin against the regulatory limits.
An initial CAE run with the baseline restraint calibration — airbag vent size 40 mm, seatbelt load limiter 4 kN, pretensioner fire time 15 ms — yields a HIC of 720 and chest deflection of 48 mm. Both exceed target. The analyst examines the head acceleration trace and observes a secondary peak at approximately 85 ms, corresponding to the head rebounding into the seatback. This suggests the airbag is bottoming out and the restraint is not managing rebound.
Two countermeasures are evaluated in CAE. First, increasing the airbag vent to 55 mm reduces internal pressure and softens the head interaction, lowering the primary peak but slightly increasing head excursion. Second, reducing the load limiter to 3.5 kN allows more chest deflection but lowers the peak belt force transmitted to the thorax. A combined run with both changes and a 5 ms earlier pretensioner fire yields HIC 480 and chest deflection 40 mm — within target. The physical sled test subsequently confirms HIC 510 and chest deflection 43 mm, a correlation delta of about 6%, which is acceptable for this stage. The design is released for prototype build.
Why This Matters for the Analyst
Injury biomechanics is not a reference subject to be memorized and set aside. It is the physical basis for every numerical target the analyst pursues. A designer who understands that HIC is duration-weighted will not waste time chasing a narrow acceleration spike that contributes little to the integral. An analyst who understands that chest deflection is a global stiffness response will look at belt geometry and seatback compliance rather than only at airbag pressure. The historical and regulatory context explains why certain tests exist and why some criteria are more stringent than others — knowledge that directly informs where to allocate design effort.
The chapters that follow build on this foundation, moving from tissue-level tolerance and injury mechanisms through dummy instrumentation, crash test configurations, CAE modeling techniques, and finally to integrated safety system optimization. Each topic connects back to the workflow shown above: tolerance data informs targets, targets drive simulation, simulation guides design, and testing validates the result.