3. Quality control challenges in crash simu
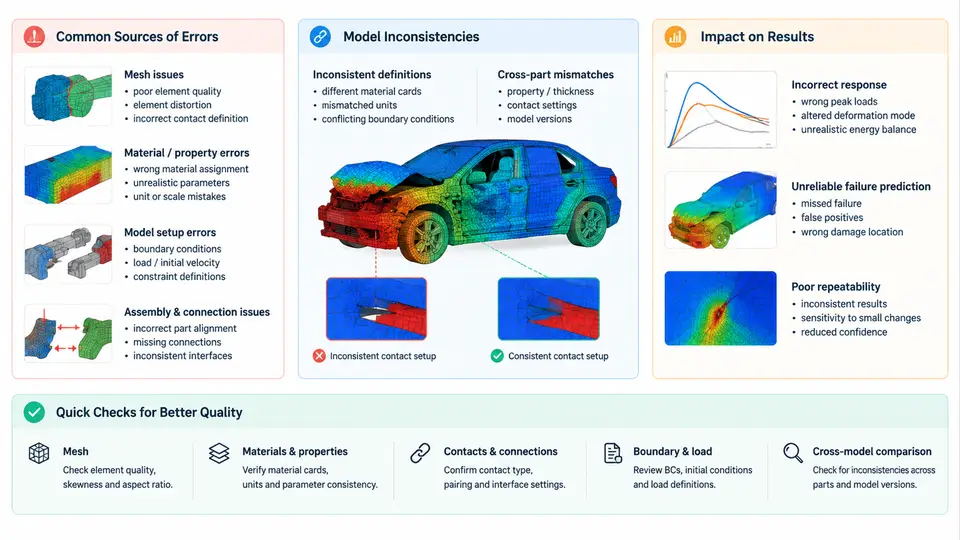
Crash simulation occupies a peculiar position in the CAE landscape: it is expensive to run, difficult to validate against physical tests, and highly sensitive to modeling decisions made weeks or months before the solver is ever invoked. A full-vehicle frontal impact model may contain 8–15 million elements, hundreds of material definitions, dozens of contact interfaces, and thousands of spot welds. Under these conditions, quality control is not a final inspection step — it is a continuous discipline that must be embedded from geometry cleanup through post-processing. This chapter examines where errors originate, how model inconsistencies propagate, and why even small defects can shift occupant injury criteria by double-digit percentages.
3.1 Taxonomy of Error Sources
Errors in crash simulation fall into four broad categories, each with distinct root causes and detection strategies.
Input data errors originate from CAD geometry, material test data, or manufacturing information. A common example is a shell mesh generated from a mid-surface that deviates from the actual stamped part by 2–3 mm due to springback compensation not being reflected in the CAD release. Another is a material card where the strain-rate hardening curve was extrapolated beyond the tested range (e.g., tested to 100 s⁻¹ but extrapolated to 1000 s⁻¹), producing artificially high flow stress at high strain rates.
Discretization errors arise from mesh density, element type selection, and time-step control. In crash analysis, shell elements dominate, and their through-thickness integration (typically 5–7 integration points for LS-DYNA Type 16 or Type 2 shells) directly affects bending behavior. A common defect is using fully integrated shells in regions expected to undergo large deformation, causing shear locking and artificially stiff response.
Modeling assumption errors include simplifications that are reasonable in static analysis but invalid in crash. Rigid body constraints applied to suspension components may be acceptable for a 50 km/h frontal impact but will suppress the suspension collapse that occurs in a 64 km/h offset deformable barrier (ODB) test. Similarly, spot welds modeled as rigid beams rather than deformable spot weld elements will not capture weld pull-out, a dominant failure mode in modern high-strength steel bodies.
Numerical errors encompass hourglassing, mass scaling, contact penetration, and time-step instability. Explicit solvers like LS-DYNA or Radioss use reduced integration by default; without adequate hourglass control (e.g., Type 4 Flanagan-Belytschko stiffness form with hourglass coefficient QM = 0.05–0.10), zero-energy modes can grow and corrupt the solution.
3.2 Model Inconsistencies Across the CAE Chain
Inconsistencies are not isolated errors but mismatches between what the model represents and what the physical system does. They typically emerge at interfaces between disciplines or between stages of the CAE workflow.
A frequent inconsistency is mass mismatch between the crash model and the actual vehicle. The crash model may omit wiring harnesses, fluid lines, or interior trim, then compensate with non-structural mass (NSM) applied to floor panels. If the NSM distribution does not match the actual center of gravity (CG) location, the vehicle's yaw inertia will be wrong, and the post-impact trajectory in a pole test will diverge from reality. A typical tolerance is CG within ±5 mm longitudinally and ±10 mm laterally, with total mass within ±1% of the physical vehicle.
Another inconsistency is connection mismatch: the number and location of spot welds in the CAE model may not match the body-in-white (BIW) weld schedule. If 15% of welds are missing in a critical load path — say, the B-pillar to rocker joint — the joint stiffness drops significantly, and the door opening deformation in a side impact will be underpredicted.
Material model inconsistency occurs when the same material is represented by different cards in different subsystems. For example, DP780 steel may use MAT_024 (piecewise linear plasticity) in the front rail but MAT_037 (transversely anisotropic) in the B-pillar, with different failure strains. This makes it impossible to compare energy absorption across the structure.
3.3 Quantifying the Impact on Results
The practical question is not whether errors exist — they always do — but how much they matter. Sensitivity studies on full-vehicle models consistently show that certain parameters dominate the response.
| Error / Inconsistency | Typical Magnitude | Observed Effect on Key Result | Detection Method |
|---|---|---|---|
| Missing spot welds in load path | 10–20% of total welds | Door opening deformation +8–15 mm; intrusion velocity +0.5–1.0 m/s | Weld count audit vs. BIW schedule; section force comparison |
| Material curve extrapolation beyond test range | Strain rate > 500 s⁻¹ | Front rail crush force +10–20%; energy absorption overpredicted | Material card review; strain-rate sensitivity check |
| Hourglass energy > 5% of internal energy | QM < 0.05 or missing control | Non-physical deformation modes; force-displacement curve noisy | GLSTAT hourglass energy ratio; visual deformation inspection |
| Mass scaling added time > 1% of total | dt < 0.5 μs | Artificial inertia; early-stage force spike; energy balance error | DT/NODOUT; added mass report in GLSTAT |
| CG offset > 10 mm lateral | NSM misplacement | Yaw during offset impact; pole test trajectory deviation | CG calculation from model; comparison with physical measurement |
These are not hypothetical. In a representative 64 km/h ODB simulation, a 15% reduction in spot weld count along the front rail-to-shotgun connection produced a 12 mm increase in toe pan intrusion and a 0.7 m/s increase in peak intrusion velocity at the brake pedal — enough to push the lower leg injury criterion (Tibia Index) from 0.85 to 1.05, crossing the regulatory threshold of 1.0.
3.4 Practical Quality Control Measures
Effective quality control in crash simulation requires a layered approach. The following measures are commonly implemented in production CAE groups.
Pre-solve checks. Before submitting a job, run automated checks on the deck: free edges in the shell mesh (unconnected nodes), initial penetrations in contact interfaces, zero-mass or zero-stiffness elements, and material cards with missing required fields. LS-DYNA's *DATABASE_CHECKPOINT and third-party tools like Animator or HyperMesh's Model Checker can flag these. A typical acceptance criterion is zero free edges in structural areas and initial penetration < 0.5 mm for all contact interfaces.
Energy balance monitoring. During the solve, monitor the GLSTAT file. The ratio of hourglass energy to internal energy should remain below 5% throughout the event. The ratio of total energy to initial kinetic energy should be within 1% at the end of the simulation (excluding external work). If the energy balance drifts, the result is not trustworthy regardless of how plausible the deformation looks.
Cross-model consistency checks. When the same vehicle is modeled for different load cases (frontal, side, rear), verify that shared subsystems — front rails, B-pillars, floor — use identical mesh, material cards, and connection definitions. A simple diff script comparing material IDs and weld counts across load cases can catch inconsistencies that would otherwise invalidate cross-load-case conclusions.
Correlation with physical tests. The ultimate quality check is correlation with a physical crash test. Key metrics include: vehicle deceleration pulse (integrated velocity change within 5%), intrusion measurements at defined points (within 10 mm), and occupant injury criteria (within 15%). When correlation fails, the error taxonomy in Section 3.1 provides a systematic troubleshooting path — start with mass and CG, then check connections, then material cards, then numerical settings.
3.5 The Cost of Poor Quality Control
The consequences of inadequate quality control extend beyond a single simulation. A model with undetected inconsistencies may produce results that appear reasonable but are systematically biased. If this model is used for design decisions — say, to reduce the gauge of a B-pillar based on simulated intrusion — the physical prototype may fail the crash test, requiring expensive tooling changes and delaying the program. In an industry where a single full-vehicle crash test costs $50,000–$150,000 and a typical program runs 50–100 simulations, the return on investing in automated quality checks is substantial.
More importantly, quality control in crash simulation is not merely about catching errors. It is about building confidence in the model so that simulation can be used predictively rather than just comparatively. A model that has passed rigorous checks — mass and CG validated, connections audited, materials verified, energy balance confirmed, and correlation established — becomes a reliable virtual test rig. That is the foundation on which automated checking and quality control systems, covered in subsequent chapters, are built.