3. Deployment physics
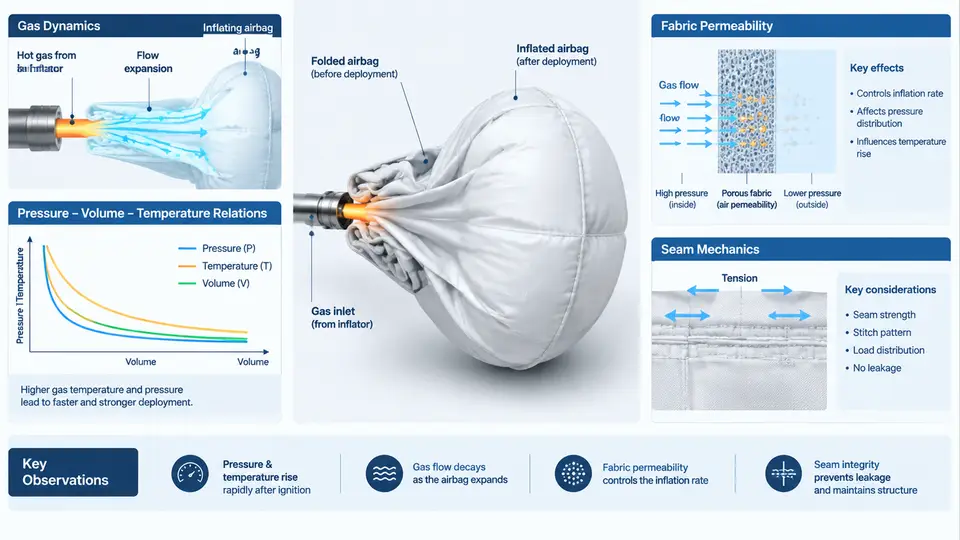
An airbag inflator is a miniature chemical reactor that must discharge its entire energy budget in roughly 20–50 ms. The cushion that receives this energy is a sewn, coated fabric structure whose mechanical response is coupled to the gas state at every instant. To correlate a CAE model with a physical deployment test, you must represent four interacting physical domains: the gas generator's mass and energy release, the thermodynamic state of the gas inside the cushion, the leakage of that gas through the fabric, and the structural behavior of the fabric and seams under biaxial tension. This section develops each domain and shows how they couple.
Gas Generation and the Inflator as a Boundary Condition
Pyrotechnic inflators burn a solid propellant; hybrid inflators release stored gas and augment it with a small pyrotechnic charge. In both cases the useful CAE input is a mass flow rate curve, ṁ(t), and a gas temperature curve, T(t), at the inflator exit. These are obtained from a tank test: the inflator fires into a fixed-volume tank, and the measured pressure rise is converted to mass and temperature using the ideal-gas relation. A representative tank-test-derived mass flow for a driver-side inflator might peak near 2.5 kg/s at 8 ms and deliver roughly 60–100 g of gas by 40 ms, but these values are inflator-specific and must never be assumed.
Inside the cushion, the gas state is governed by the conservation of mass and energy. For a control volume with inflow ṁin, outflow through fabric ṁout, and internal energy e = cvT:
dm/dt   = ṁ_in − ṁ_out
d(m·c_v·T)/dt = ṁ_in·c_p·T_in − ṁ_out·c_p·T − P·dV/dt + Q̇_loss
The term P·dV/dt is the work done expanding the cushion; Q̇_loss accounts for heat transfer to fabric and ambient. In a fast deployment, P·dV/dt dominates and the process is closer to adiabatic than isothermal, so the gas cools as it expands. This is why the pressure–volume trajectory is not a simple isotherm.
Pressure–Volume–Temperature Relations
The cushion pressure is not uniform during the first milliseconds. A pressure wave propagates from the inflator, and the cushion inflates as a moving membrane. For correlation work, however, a lumped P-V-T model is usually sufficient and is the basis of the standard tank-test reduction. The ideal-gas law P·V = m·R·T links the three state variables; real-gas corrections (van der Waals or Redlich–Kwong) matter only at the very high initial pressures inside the inflator, not in the cushion.
A useful diagnostic is the P-V diagram of the cushion. Plotting measured or simulated pressure against volume traces a loop: rapid pressure rise at near-constant volume while the cushion unfolds, then pressure decay as volume grows and gas leaks. The area under the expansion branch is the work delivered to the occupant. If a CAE model over-predicts peak pressure but matches the decay, the inflator mass flow is too high; if it matches peak but decays too slowly, the permeability or venting is under-represented.
Fabric Permeability
Coated and uncoated fabrics leak. The leakage path is through the weave interstices and, for coated fabrics, through pores and coating defects. Permeability is characterized by the fabric permeability coefficient, typically measured per ASTM D737 or ISO 9237, and expressed as volumetric flow per unit area per unit pressure drop. For CAE, the mass outflow is modeled as:
ṁ_out = C_perm · A · (P_cushion − P_ambient)^nwhere Cperm is the permeability coefficient, A is the wetted fabric area, and n is an exponent near 0.5–1.0 depending on the flow regime. Uncoated nylon may have Cperm on the order of 1–10 L/(dm²·min·kPa), while silicone-coated fabric can be one to two orders of magnitude lower. Permeability increases with biaxial strain because the weave opens; a strain-dependent permeability model is therefore more accurate than a constant one for high-pressure deployments.
Permeability is the single most common source of test–CAE mismatch. A model calibrated at low pressure will under-predict leakage at peak pressure if the exponent n is set to 1.0 when the real flow is closer to orifice-like (n ≈ 0.5).
Seam Mechanics
Seams are the weak link. A typical airbag seam is a double-locked stitch or a chain stitch with 4–6 stitches per cm, using bonded nylon thread. Under inflation, the seam carries the hoop stress that resists the internal pressure. The seam efficiency—the ratio of seam strength to fabric strength—is typically 70–90% for well-designed seams. Failure modes include thread rupture, fabric tear at the stitch line, and seam slippage.
In CAE, seams are represented either as tied contact with a failure criterion or as cohesive elements with a traction–separation law. The peak traction and critical separation energy must be calibrated from coupon tests (ASTM D1683 for seam slippage, ASTM D5034 for grab tensile). A common error is to model the seam as rigidly tied; this suppresses the local fabric rotation that real seams allow and over-predicts the cushion's ability to hold pressure.
Coupling and Correlation Strategy
The four domains are not independent. Gas temperature affects fabric stiffness (hot nylon is softer), permeability depends on the pressure differential that the gas state produces, and seam strength depends on the local stress state that the cushion pressure generates. A correlation workflow should therefore proceed in a defined order:
- Calibrate the inflator. Match the tank-test mass flow and temperature curves first. Do not proceed until the inflator boundary condition is correct.
- Calibrate permeability at low pressure. Use a static pressure-hold test on a sealed cushion to isolate Cperm and n without the complication of unfolding.
- Calibrate seam behavior. Use coupon-level tests to fit the cohesive law, then verify at the sub-assembly level.
- Validate the coupled model. Compare P-V loops and cushion kinematics against the full deployment test. Adjust only one parameter at a time and re-check the diagnostic mapping above.
Practical Example: Interpreting a Mismatch
Suppose a driver-side CAE model predicts a peak cushion pressure of 180 kPa at 25 ms, while the test measures 150 kPa at 25 ms. The decay after 40 ms matches within 5%. Using the diagnostic mapping, the peak discrepancy with matching decay points to the inflator mass flow being too high. The correct action is to re-examine the tank-test reduction: check whether the tank volume was measured correctly, whether the gas temperature was assumed rather than measured, and whether the mass flow was integrated over the correct time window. Adjusting permeability would be wrong because it would also change the decay, which currently matches.
Conversely, if the peak matches but the pressure at 60 ms is 20 kPa too high, the model is retaining gas that the real cushion has already leaked. Check Cperm and n. If the fabric is coated and the model uses an uncoated permeability value, the leak rate will be far too low. If the model uses n = 1.0 but the real flow is orifice-like (n ≈ 0.5), the leak rate will be under-predicted at high pressure and over-predicted at low pressure—a pattern that shows up as a crossover in the P-V loop.
Key Parameters for Correlation
| Domain | Parameter | Typical Source | Effect if Wrong |
|---|---|---|---|
| Inflator | ṁ_in(t), T_in(t) | Tank test | Peak pressure error, wrong energy input |
| Gas state | c_v, c_p, R | Gas composition | Temperature and pressure decay error |
| Permeability | C_perm, n | ASTM D737 / ISO 9237 | Decay rate error, P-V loop shape |
| Seam | Peak traction, separation energy | ASTM D1683 / D5034 | Premature or suppressed seam failure |
Each parameter must be traceable to a measurement or a documented assumption. When a CAE model matches a test, the match is only meaningful if the parameter set is physically defensible. A model tuned to match one test by distorting permeability will fail on the next test with a different inflator or fabric. The goal of correlation is not a single matching curve but a parameter set that predicts correctly across the operating range.