3. Crash test instrumentation for airbag de
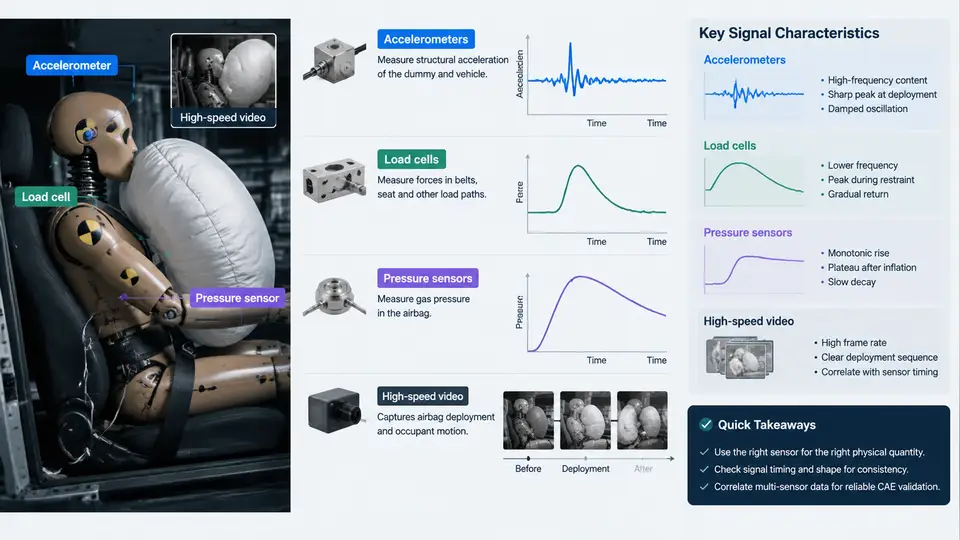
Airbag CAE correlation depends on the quality of the physical measurements used as boundary conditions and validation targets. Before any solver output can be trusted, the instrumentation chain must be understood: what each sensor physically measures, how its signal is conditioned and filtered, and where systematic errors can enter. This chapter covers the four primary instrumentation families used in a frontal or side impact test — accelerometers, load cells, pressure sensors, and high-speed video — and the signal characteristics that determine their usefulness for airbag deployment correlation.
Accelerometers: The Primary Deployment Trigger Signal
Accelerometers convert rigid-body acceleration into an electrical signal, most commonly via a piezoelectric or piezoresistive MEMS element. In a full-scale crash test, accelerometers are mounted on the vehicle body (B-pillar base, tunnel, sill, rear crossmember), on the occupant restraint system (seat frame, steering column), and on the crash test dummy (head, chest, pelvis). The signal that matters most for airbag deployment is the body-mounted longitudinal acceleration, because the airbag ECU uses this channel to run its crash discrimination algorithm.
Typical full-scale frontal impact accelerometers have a range of ±500 g to ±2000 g, a sensitivity around 0.1–1.0 mV/g, and a frequency response from DC (piezoresistive) or 0.5 Hz (piezoelectric) up to 5–10 kHz. The raw signal is sampled at 10–20 kHz per channel with at least 12-bit resolution. Two filtering stages are applied: an analog anti-alias filter before the ADC, and a digital low-pass filter after acquisition. SAE J211 specifies the channel filter classes — CFC 60 for occupant response, CFC 180 for structural acceleration, and CFC 1000 for high-frequency events. For airbag ECU correlation, the relevant filter is typically CFC 60 or the ECU's own internal filter, because the deployment decision is made on a filtered acceleration integral.
A critical practical point: the accelerometer mounting location must match the ECU mounting location as closely as possible. A 100 mm offset on the tunnel can shift the acceleration onset by 0.5–1.5 ms, which is significant when the deployment threshold is evaluated in the 10–30 ms window. The signal characteristic to watch is the pre-trigger baseline — any DC offset or drift before t=0 will bias the velocity integral and corrupt the deployment timing prediction.
Load Cells: Measuring Belt and Structural Forces
Load cells are strain-gauge or piezoelectric transducers that measure force directly. In airbag correlation tests, they appear in three main roles: seat belt load cells (webbing tension), steering column load cells (column compression), and structural load cells (barrier or sled force). A seat belt load cell typically has a range of 0–20 kN, a sensitivity of 1–2 mV/V, and a frequency response of 0–1 kHz. The signal is conditioned by a bridge amplifier and filtered at CFC 60 or CFC 180 depending on the measurement purpose.
The key signal characteristic of a load cell is its nonlinearity and hysteresis, usually specified as a percentage of full scale (e.g., ±0.5% FS). For airbag correlation, the belt force time history is used to validate the restraint model's force-limiting behavior. If the load cell is mounted in-line with the belt, it measures the total belt tension; if mounted at the anchor, it measures the anchor reaction. These are not the same signal, and the CAE model must represent the same boundary condition. A common correlation error is comparing a model's belt element force to an anchor load cell measurement without accounting for the geometry and friction between them.
Pressure Sensors: Airbag Internal Pressure and Cavity Pressure
Pressure sensors are used in two distinct ways. First, airbag internal pressure sensors measure the gas pressure inside the inflating cushion, typically 0–300 kPa absolute or gauge, with a response time under 1 ms. This signal is the most direct validation target for the inflator model and the cushion fabric permeability model. Second, cavity pressure sensors measure pressure inside a closed volume such as a door cavity or engine compartment, used to validate structural deformation and airbag interaction.
The signal characteristic that matters most is the thermal transient. Inflator gas is hot (600–1000 K at the nozzle), and the pressure sensor diaphragm sees a temperature spike that can cause a false offset if the sensor is not thermally compensated. The measured pressure peak may occur 2–5 ms after the actual gas mass flow peak because of the finite filling time of the cushion. When correlating CAE to test, the pressure curve should be compared in both magnitude and phase — a model that matches peak pressure but not the rise time will not correctly predict the cushion deployment kinematics.
High-Speed Video: Kinematic Ground Truth
High-speed cameras record at 1000–10,000 frames per second, with typical resolutions of 1280×720 to 1920×1080. At 1000 fps, the temporal resolution is 1 ms; at 5000 fps, it is 0.2 ms. The camera is synchronized to the test trigger via a pre-trigger signal, and the exposure time is set short enough (typically 1/5000 to 1/20000 s) to avoid motion blur. For airbag deployment, the camera views the occupant compartment from the side and from the front, capturing the cushion unfolding, the dummy interaction, and the timing of the deployment relative to the dummy's forward excursion.
Video is not a signal in the electrical sense, but it has signal characteristics that affect correlation: frame rate, shutter timing, and spatial calibration. A 1000 fps camera cannot resolve events shorter than 1 ms, so the initial tear seam opening and the first 5 ms of cushion expansion may be undersampled. The video is used to extract displacement time histories via tracking markers on the dummy and the airbag, and these are compared to the CAE model's nodal displacement. The synchronization between video and accelerometer data must be verified — a 1 ms offset between the video trigger and the data acquisition trigger will produce an apparent 1 ms discrepancy in deployment timing that is purely an instrumentation artifact.
Signal Characteristics That Drive Correlation Quality
Each sensor family has a characteristic that dominates its contribution to correlation error. For accelerometers, it is the mounting location and pre-trigger baseline. For load cells, it is the boundary condition mismatch between the measurement point and the model's force extraction point. For pressure sensors, it is the thermal transient and phase lag. For high-speed video, it is the temporal and spatial calibration.
A practical correlation workflow should therefore begin with a signal audit before any CAE comparison. The audit checks four things: (1) the time-zero alignment across all channels, (2) the filter class applied to each channel and whether it matches the CAE output filter, (3) the sensor range and whether any channel clipped during the event, and (4) the synchronization between video and electrical data. A clipped accelerometer channel, for example, will show a flat-topped peak that the CAE model cannot reproduce, leading to a false conclusion that the model is wrong when the measurement is saturated.
Example: Instrumentation Audit for a Frontal 56 km/h ODB Test
Consider a 56 km/h offset deformable barrier (ODB) test with the following instrumentation: tunnel accelerometer (CFC 60, ±2000 g), B-pillar accelerometer (CFC 60, ±2000 g), driver seat belt load cell (CFC 60, 0–20 kN), passenger airbag internal pressure sensor (unfiltered, 0–300 kPa), and two high-speed cameras at 2000 fps. The CAE model outputs nodal acceleration at the tunnel node, belt element force, and airbag cavity pressure.
The audit reveals: the tunnel accelerometer has a 0.3 g pre-trigger offset, which integrates to a 0.5 m/s velocity error over 20 ms — this must be removed before comparison. The belt load cell is mounted at the anchor, but the CAE model extracts force at the retractor; the two differ by the belt path friction and geometry, so the comparison must either move the model extraction point or apply a correction. The pressure sensor shows a 5 kPa thermal offset in the first 3 ms, which is within the sensor's specified thermal compensation but still visible in the correlation plot. The video sync is verified by a flashing LED at t=0, and the frame timing is confirmed to be within 0.5 ms of the electrical trigger.
After these corrections, the correlation targets are: tunnel acceleration peak within ±10% of test, belt force peak within ±15%, and airbag pressure rise time within ±1 ms. These tolerances are typical for a mature CAE model; a new model may start at ±25% and be refined through iterative correlation.
Key Takeaways
- Accelerometers provide the ECU deployment signal; mounting location and pre-trigger baseline are the dominant error sources.
- Load cells measure force at a specific boundary; the CAE model must extract force at the same boundary or a correction must be applied.
- Pressure sensors are sensitive to thermal transients; compare both magnitude and phase (rise time) to the CAE model.
- High-speed video provides kinematic ground truth but requires verified temporal and spatial calibration.
- Always perform a signal audit — time-zero, filter class, clipping, and sync — before any CAE correlation.