1. Crash test signal processing for airbag
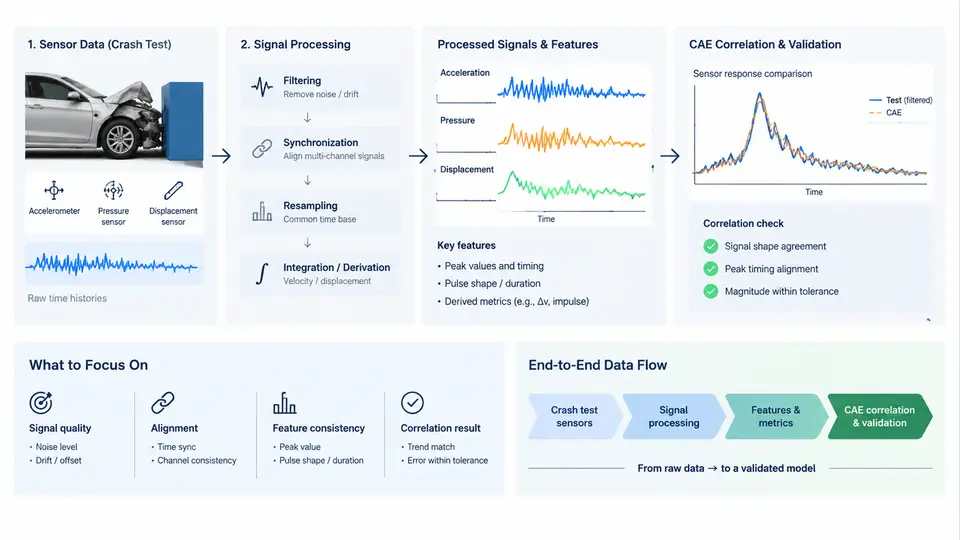
Airbag CAE correlation is the discipline of making a finite element (FE) occupant-restraint model reproduce what actually happened in a physical crash test. The model itself — the sled or full-vehicle LS-DYNA deck, the dummy, the airbag folded geometry, the inflator gas model — is only half of the problem. The other half is the measurement chain that produces the reference curves the model is compared against. If the reference is wrong, the correlation is meaningless, no matter how refined the mesh is. This course is about that measurement chain: how raw accelerometer, load cell, and pressure signals from a crash test are turned into defensible, filter-consistent, time-zeroed reference data, and how that data is then mapped onto the CAE model so that a validation decision can be made.
What "correlation" actually requires
Correlation is not a single number. In restraint CAE it is a structured comparison between test and simulation across a defined set of channels, over a defined time window, using a defined filtering and alignment convention. Typical channels for an airbag-focused correlation include:
- Sled / vehicle deceleration — the input boundary condition, usually a uniaxial or triaxial accelerometer on the buck or body-in-white.
- Dummy responses — head resultant acceleration (ar), chest deflection, chest resultant acceleration, pelvis acceleration, and neck loads where instrumented.
- Airbag state — tank pressure or inflator chamber pressure, bag internal pressure (via a pressure transducer in the module or a tethered sensor), and deployment timing (time-to-first-gas, TTFG).
- Restraint loads — seat belt load cell (SBL), buckle load, retractor force, and anchor loads.
The CAE side must reproduce these same quantities at the same physical locations. That is why the processing conventions matter: a chest resultant acceleration filtered at CFC 600 in the test cannot be compared against an unfiltered nodal acceleration from the model, and a test signal time-zeroed at the sled trigger cannot be compared against a model time-zeroed at t = 0 of the solver deck unless the offset is explicitly reconciled.
The end-to-end data flow
The pipeline from sensor to validated model has six stages. Each stage has a defined input, a defined operation, and a defined output that the next stage consumes.
- Transduction and acquisition. Sensors convert physical quantities to voltage or charge. The data acquisition system (DAS) samples at a rate high enough to avoid aliasing — for crash signals, 10 kHz to 20 kHz per channel is common, with anti-alias filtering applied before digitization. Output: raw time-series in engineering units, plus a channel map and calibration record.
- Pre-processing. This covers offset removal (pre-trigger baseline subtraction), spike and dropout detection, and verification of sensor polarity and sign convention. Output: cleaned, sign-consistent raw signals.
- Filtering. Each channel is filtered according to its measurement class, following SAE J211 / ISO 6487 channel frequency class (CFC). Accelerometers on the dummy are typically CFC 1000 or CFC 600; chest deflection is CFC 180; belt loads are CFC 600 or CFC 1000 depending on the program. Output: filtered signals with a documented CFC per channel.
- Time alignment. All channels are referenced to a common time zero — usually the sled trigger or the vehicle fire signal — and cross-channel delays (e.g., DAS channel skew, sensor cable delay) are corrected. Output: a time-aligned, multi-channel test dataset.
- CAE model setup and run. The FE deck is built with the same boundary conditions, the same dummy positioning, and the same airbag/inflator representation. The solver produces nodal and element time histories at the corresponding locations. Output: raw simulation curves.
- Correlation and validation. Test and simulation curves are filtered to the same CFC, aligned to the same time zero, and compared using objective metrics (e.g., CORA, ISO/TS 18571, or a program-specific rating). Output: a correlation report and a pass/fail or rating decision per channel.
Why the flow is drawn as a chain, not a checklist
The stages are dependent. A polarity error introduced at stage 2 propagates through filtering and alignment and shows up as a sign-flipped correlation curve at stage 6. A wrong CFC at stage 3 shifts the peak timing and makes a good model look bad. A time-zero mismatch at stage 4 produces a phase error that no amount of mesh refinement can fix. The figure below shows the chain with the concrete artifacts that move between stages, and the feedback path where a correlation failure is traced back to its source.
Scope boundaries of this course
This course covers the test-side processing and the test-to-CAE mapping. It does not cover airbag folding simulation, inflator gas-dynamics modeling, or dummy model development in detail — those are separate disciplines. What it does cover, chapter by chapter, is the set of decisions that determine whether a correlation is trustworthy:
- Sensor selection and placement for restraint-relevant channels.
- Acquisition settings, anti-alias filtering, and calibration verification.
- SAE J211 / ISO 6487 filtering classes and how to apply them consistently on both test and CAE sides.
- Time-zero definition, trigger handling, and cross-channel alignment.
- Objective correlation metrics and how to interpret them.
- Root-cause tracing when a channel fails correlation.
A concrete example of the flow in practice
Consider a frontal sled test with a 50th-percentile Hybrid III dummy. The sled deceleration is measured by a uniaxial accelerometer at CFC 60 (the sled pulse is a low-frequency input). The dummy head accelerometer is recorded at CFC 1000. The chest deflection is measured by a string potentiometer at CFC 180. The airbag tank pressure is recorded at CFC 1000. The DAS samples all channels at 20 kHz with a 5 kHz anti-alias filter.
On the CAE side, the sled pulse is applied as a prescribed velocity or acceleration boundary condition using the filtered test pulse. The head accelerometer output is requested as a nodal acceleration at the head CG, then filtered at CFC 1000 before comparison. The chest deflection is extracted from the dummy model's chest displacement output and filtered at CFC 180. The tank pressure is taken from the inflator model's pressure output and filtered at CFC 1000.
If the head acceleration correlation shows a peak that is 15% low but correctly timed, the issue is likely in the model — airbag pressure, venting, or contact stiffness. If the peak is correctly sized but arrives 3 ms late, the issue is likely in the time alignment or in the airbag deployment timing (TTFG). The failure-symptom table in the figure above is the first diagnostic step, not the last.
What you should be able to do after this chapter
You should be able to describe the six stages of the sensor-to-model flow, identify which stage is responsible for a given correlation symptom, and state the filtering and time-alignment conventions that must match between test and CAE. The remaining chapters build on this foundation: each stage is expanded with the specific procedures, parameters, and acceptance criteria used in production restraint CAE correlation work.