3. Occupant restraint physics in center imp
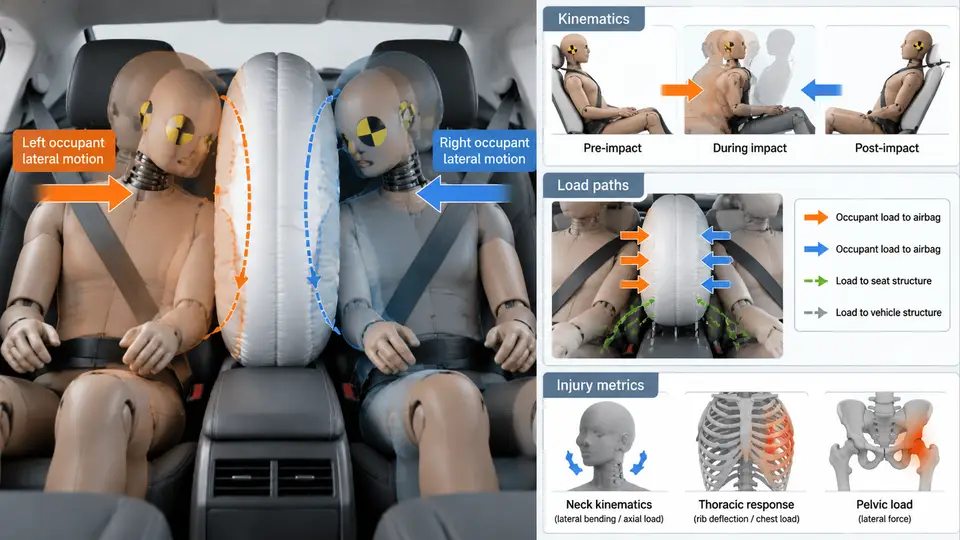
Center impact — a pole or narrow rigid barrier striking near the vehicle centerline — differs fundamentally from full-frontal or offset deformable barrier (ODB) loading. Because the struck structure is narrow, the vehicle decelerates through a concentrated crush zone rather than distributing load across the full front end. The occupant compartment therefore experiences a sharper, shorter-duration pulse, and restraint systems must manage a body that is translating forward while the vehicle yaws and pitches around it. This section builds the physical picture needed to interpret both sled and CAE results: how the occupant moves, where the loads travel, and which metrics decide pass or fail.
Coordinate Convention and Pulse Definition
All quantities in this chapter use the SAE vehicle coordinate system: x positive forward, y positive to the driver's right, z positive upward, with the origin at the vehicle centerline at ground level. Occupant motion is described in the same frame unless a local body frame is explicitly stated. The crash pulse is the compartment deceleration a_x(t) measured at the rocker or tunnel; it is the input that drives occupant kinematics, not the barrier force itself.
For a center pole impact at 32 km/h (8.89 m/s), a representative compartment pulse might rise to roughly 35–45 g within 15–25 ms and return to zero by 80–110 ms. These values are illustrative of the class of event, not measured data. The key point is the shape: a steep rise produces a high occupant-to-vehicle velocity differential early, which is exactly when belt slack and airbag deployment timing matter most.
Occupant Kinematics: Three Phases
Restrained occupant motion in center impact can be decomposed into three overlapping phases.
- Free travel (0 to ~15 ms). The occupant continues at the initial velocity while the vehicle decelerates. Relative displacement accumulates until belt slack and webbing stretch are consumed. A typical 3-point belt has 30–60 mm of effective slack; at 8.89 m/s this is consumed in a few milliseconds, so pretensioning is decisive.
- Restraint engagement (~15 to ~60 ms). The belt loads the pelvis and chest; the airbag contacts the head and upper torso. The occupant decelerates, but the head lags the torso because the neck transmits load with a delay. This creates the head-to-torso relative rotation that drives neck injury metrics.
- Rebound and secondary contact (~60 ms onward). After the pulse, the occupant rebounds into the seat. In center impact, yaw of the vehicle means the occupant may also translate laterally, so the head can load the airbag off-center or slip past it.
The critical kinematic variable is the occupant-to-vehicle velocity differential, Δv(t) = v_occupant(t) − v_vehicle(t). It is this differential, not absolute velocity, that determines belt force and airbag interaction energy. In CAE, Δv is obtained by integrating the difference between the occupant accelerometer and the compartment accelerometer.
Load Paths Through the Restraint System
Load enters the occupant through three primary paths, and each must be checked separately in a correlation study.
- Belt path — pelvis and chest. Lap belt load runs from the iliac crests into the buckle and anchorages; shoulder belt load runs from the chest into the retractor and D-ring. Peak shoulder belt force in a 32 km/h center pole event typically falls in the 4–7 kN range for a 50th percentile male, again as an illustrative band.
- Airbag path — head and upper torso. The airbag converts occupant kinetic energy into gas compression and venting. The relevant parameters are bag pressure, vent size, and the standoff distance between the head and the module at the time of contact.
- Structural path — knee bolster and floor. Knee bolster load limits pelvis forward excursion and helps keep the occupant in the belt. In center impact, the narrow crush zone can push the toe pan rearward, so lower-extremity loading is often higher than in ODB.
These paths interact. If the knee bolster is too soft, the pelvis travels further, the lap belt loads later, and the chest takes more load. If the airbag vents too quickly, the head penetrates and neck tension rises. Correlation work must therefore treat the restraint as a coupled system, not a set of independent components.
Injury Metrics and Their Physical Meaning
Each metric maps to a specific load path and must be read together with the kinematic phase in which it peaks.
| Metric | Physical quantity | Typical limit (illustrative) | Peak phase |
|---|---|---|---|
| HIC15 | Resultant head acceleration integral | 700 | Airbag contact, 30–60 ms |
| Nij | Neck force/moment combination | 1.0 | Head lag, 40–70 ms |
| Chest deflection | Sternum-to-spine compression | 50 mm | Belt engagement, 30–55 ms |
| Chest a_3ms | 3 ms clip of chest acceleration | 60 g | Belt engagement |
| Femur load | Axial force per leg | 10 kN | Knee bolster contact |
HIC15 is dominated by the head resultant acceleration, so it is sensitive to airbag pressure and venting. Nij is sensitive to the timing difference between head and torso deceleration; a bag that fires too late lets the head rotate forward before contact, raising N_te. Chest deflection is governed mainly by shoulder belt force and belt geometry. Femur load is governed by knee bolster stiffness and toe pan intrusion.
Correlation Implications for CAE
When correlating a CAE model to a sled or vehicle test, the following sequence is efficient and avoids compensating errors.
- Match the pulse first. Compare the CAE compartment
a_x(t)to the test pulse. If the peak or duration differs by more than about 10%, fix the structural model before touching the restraint model. - Check Δv. Plot occupant-to-vehicle velocity differential for both. A mismatch here means belt slack, pretensioner timing, or seat stiffness is wrong.
- Compare belt forces. Shoulder and lap belt force time histories reveal whether the belt is loading too early or too late.
- Compare airbag pressure and head contact time. If head contact occurs before the bag is fully deployed, HIC will be over-predicted in CAE or under-predicted in test depending on the model.
- Only then compare injury metrics. Metrics are the output of the chain; matching them without matching the intermediate physics is coincidental.
Worked Example: Reading a Mismatch
Suppose a CAE model predicts HIC15 = 620 while the sled test measures 810, and the pulse and belt forces match well. The likely cause is head-to-bag interaction. Check the head contact time: if CAE shows contact at 28 ms but the test film shows 38 ms, the model's bag is deploying too early or the head is traveling too slowly. Verify the head CG trajectory against high-speed video, then check bag pressure at contact. A 10–15 kPa pressure difference at contact can shift HIC by 100–150 points. Adjusting vent area or inflator mass flow to match the measured pressure history is the correct fix; adjusting HIC directly is not.
In center impact, also verify lateral head motion. Because the vehicle yaws, the head may contact the bag off-center. If the CAE model constrains the head to the sagittal plane, it will miss this and under-predict both HIC and Nij. Confirm that the occupant model has full 6-DOF head and neck motion and that the seat and belt are modeled with realistic lateral compliance.
Understanding these three layers — kinematics, load paths, and metrics — gives the engineer the ability to diagnose why a CAE result diverges from test, rather than merely observing that it does. The next step in correlation work is to quantify how sensitive each metric is to each input parameter, which is the subject of the following section.