3. Physical test instrumentation and data a
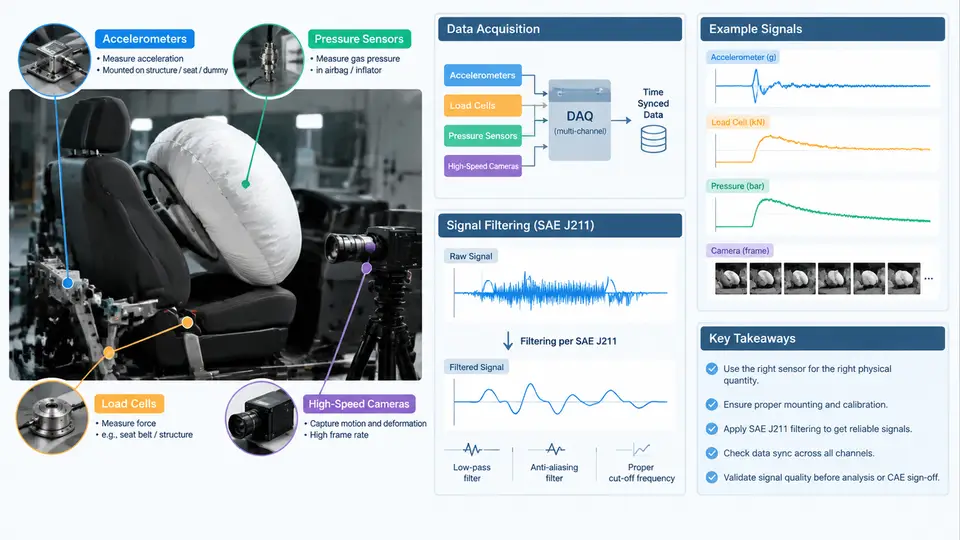
An airbag validation test is only as trustworthy as the measurement chain that feeds it. A sled test, a static deployment, or a full vehicle crash can produce a visually convincing event while the recorded data is unusable — clipped channels, aliased peaks, or a pressure trace that lags the actual bag inflation by several milliseconds. This chapter covers the sensor set typically deployed for airbag physical validation, how each transducer is mounted and ranged, how the signals are conditioned and digitized, and how SAE J211 filtering is applied so that physical test data and CAE output can be compared on equal terms.
Sensor Set and Physical Principles
Accelerometers. Piezoresistive and capacitive accelerometers dominate crash testing. They measure the acceleration of the structure to which they are bolted, not the occupant. For airbag work, the critical locations are the vehicle body at the airbag module mounting points, the seat structure, and the B-pillar or tunnel for the reference crash pulse. A typical full-vehicle channel uses a ±500 g range with a 10 kHz or higher sample rate; occupant-compartment channels may use ±200 g. Mounting stiffness matters: a bracket that resonates below 2 kHz will corrupt the pulse. Accelerometers are mounted with their sensitive axis aligned to the vehicle coordinate system, and the sign convention must be declared up front — SAE J211 and ISO 6487 both define positive X as forward, positive Y as left, positive Z as up, and this convention must be held consistently across every channel and every CAE output.
Load cells. Load cells quantify the force transmitted through a structural path — for example, the force at the airbag module attachment, the steering column, or a seat belt anchor. Strain-gauge load cells are preferred for their linearity and low drift. Range selection follows the expected peak: a module attachment may see 3–8 kN during deployment, so a 10 kN cell gives adequate headroom without sacrificing resolution. Load cells are calibrated in-line with their cabling and amplifier, because cable capacitance and connector resistance shift the effective sensitivity.
Pressure sensors. In-bag pressure is the most direct indicator of inflator output and bag fill. Piezoresistive absolute or gauge pressure sensors are mounted through the bag fabric or via a port in the module housing. A 0–500 kPa range with a 100 kHz sample rate is common for capturing the rapid inflation transient, which can rise from ambient to peak in under 30 ms. The sensor must be thermally compensated, because the inflator gas is hot and the sensor diaphragm sees a temperature step that would otherwise appear as a pressure offset.
High-speed cameras. Cameras do not produce a calibrated physical quantity, but they provide the spatial and temporal context that no transducer can. A 1000–2000 fps camera at 1280×720 is typical for bag deployment; 5000 fps or higher is used for tear-seam and tether studies. Cameras are synchronized to the data acquisition system through a common trigger, and a visible time code or LED flash is recorded in-frame so that video frames can be aligned to the analog channels to within one frame period.
Signal Conditioning and Digitization
Every transducer feeds a signal conditioner that provides excitation, amplification, and anti-alias filtering before the analog-to-digital converter. The anti-alias filter is a low-pass filter set at or below the Nyquist frequency — for a 10 kHz sample rate, the anti-alias corner is typically 4 kHz. This filter is not the SAE J211 filter; it exists to prevent high-frequency content from folding back into the passband. Confusing the two is a common and costly error.
Digitization resolution should be at least 12 bits, preferably 16 bits, so that the quantization step is well below the sensor's noise floor. The data acquisition system records a pre-trigger buffer of 50–100 ms so that the event onset is captured, and a post-trigger window long enough to cover bag deflation and occupant rebound — typically 250–500 ms for a full-vehicle test.
SAE J211 Filtering
SAE J211 (and its international counterpart ISO 6487) defines the channel filter class used to process crash data. The standard specifies a fourth-order Butterworth low-pass filter with a specified cutoff frequency, designated as CFC (Channel Frequency Class). The filter is applied in post-processing, after digitization, and its purpose is to remove high-frequency noise and structural ringing that is not relevant to the injury or performance metric being evaluated.
| CFC | Cutoff (−3 dB) | Typical application |
|---|---|---|
| CFC 60 | 100 Hz | Occupant chest and pelvis acceleration, belt force |
| CFC 180 | 300 Hz | Head acceleration, neck force and moment |
| CFC 600 | 1000 Hz | Vehicle body acceleration, module attachment force |
| CFC 1000 | 1650 Hz | In-bag pressure, high-rate structural response |
The filter must be applied in both forward and reverse directions (zero-phase filtering) so that no time shift is introduced. A single-pass causal filter would delay the signal by several milliseconds, which is unacceptable when comparing a physical pressure trace to a CAE pressure trace. The standard also requires that the filter be applied to the raw digitized data, not to data that has already been filtered or smoothed by another process.
Practical Example: In-Bag Pressure Channel Setup
Consider a driver-side airbag static deployment test. The pressure sensor is a 0–500 kPa piezoresistive transducer with a 0.5–4.5 V output, mounted through the bag fabric at the module throat. The signal conditioner provides 5 V excitation and a gain of 2, feeding a 16-bit DAQ at 100 kHz. The anti-alias filter is set to 40 kHz. The pre-trigger buffer is 100 ms and the post-trigger window is 400 ms.
Channel: P_bag_01
Sensor: 0-500 kPa, 0.5-4.5 V ratiometric
Excitation: 5.00 V
Gain: 2.0
Sample rate: 100 kHz
Anti-alias: 40 kHz, 4th-order Butterworth
CFC: 1000 (post-process)
Pre-trigger: 100 ms
Post-trigger: 400 ms
Trigger: inflator current, 2 A threshold, rising edge
After acquisition, the raw voltage is converted to pressure using the calibration curve, then filtered at CFC 1000. The expected result is a pressure rise beginning within 2–3 ms of the trigger, a peak of 200–280 kPa at 20–40 ms depending on inflator output and bag volume, and a decay as the bag vents. If the trace shows a peak below 150 kPa, check for a blocked pressure port or a sensor that has been pushed out of the bag. If the rise is delayed by more than 5 ms relative to the inflator current, suspect a trigger synchronization error or a sensor mounted too far from the module throat.
Data Quality Checks Before Sign-Off
Before any physical dataset is used for CAE correlation, run a channel-by-channel integrity check. Verify that the pre-trigger baseline is flat and within the sensor's noise specification. Confirm that no channel has clipped — a flat-topped peak means the range was too low and the data must be discarded. Check that the trigger time is consistent across all channels and that the high-speed video time code aligns with the analog trigger. Finally, confirm that the CFC class applied to each channel matches the class applied to the corresponding CAE output. Only then is the dataset ready for the physical-to-CAE comparison that drives model sign-off.