3. Inflation physics fundamentals
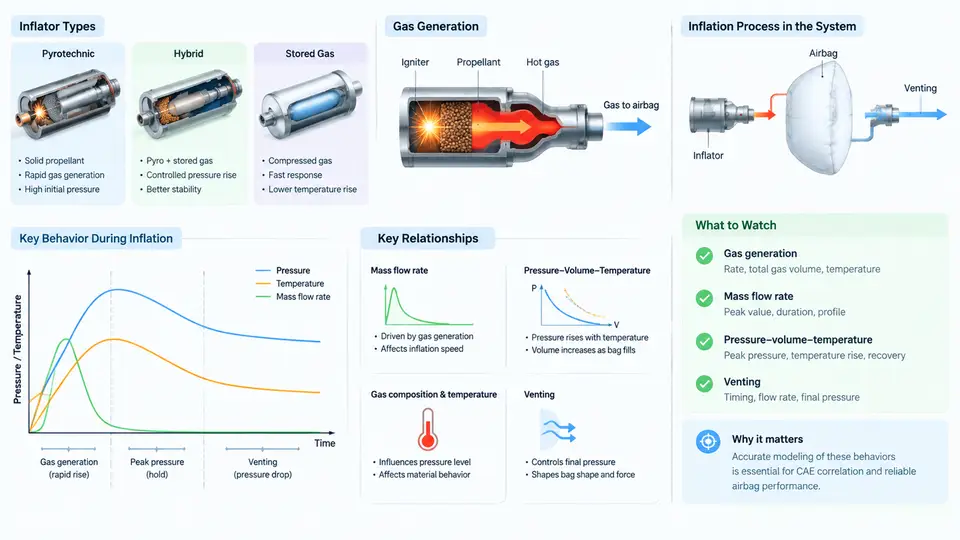
An airbag is, at its core, a controlled gas-release device. The restraint performance that protects an occupant in a crash is determined within roughly 30–50 ms by how quickly and how much gas enters the cushion, how that gas expands against the folding geometry, and how it subsequently escapes through vents. Understanding the underlying physics is therefore not academic — it is the foundation for interpreting tank pressure traces, correlating CAE models, and diagnosing mismatches between simulation and test.
3.1 Where the Gas Comes From: Pyrotechnic and Hybrid Inflators
Two inflator families dominate passenger-vehicle airbag systems, and they generate gas by fundamentally different mechanisms.
Pyrotechnic inflators burn a solid propellant — typically sodium azide-based in older designs, or modern non-azide formulations such as guanidine nitrate with oxidizers. The reaction is exothermic and self-sustaining once initiated by the squib. Gas output is essentially a combustion product: the propellant mass is converted almost entirely into hot gas, with a small fraction of solid particulate. Because the reaction is fast and the gas is hot (often 1000–2000 K at the combustion zone), pyrotechnic inflators deliver high mass flow but require careful thermal management and particulate filtration.
Hybrid inflators combine a small pyrotechnic charge with a stored compressed gas — usually argon or helium at 20–40 MPa in a pressure vessel. The pyrotechnic charge acts as a heater: it ruptures a burst disc and heats the stored gas as it expands through the inflator. The result is a cooler, cleaner gas mixture with a longer, more controllable pressure plateau. Hybrid inflators are common in side airbags and curtain airbags, where a gentler inflation profile reduces the risk of occupant injury from the deploying cushion itself.
The choice between the two affects not only the gas temperature and composition but also the shape of the mass flow rate curve, which is the single most important input to any inflation CAE model.
3.2 Mass Flow Rate: The Driving Input
Mass flow rate, ṁ(t), describes how many kilograms of gas leave the inflator per second. It is the primary boundary condition that a CAE solver integrates to obtain the gas mass inside the cushion at any instant. For a pyrotechnic inflator, ṁ(t) rises sharply within 2–5 ms of squib firing, peaks, and then decays as propellant is consumed. For a hybrid inflator, the profile is broader, with a slower rise and a longer tail.
In practice, ṁ(t) is not measured directly. It is inferred from a tank test: the inflator is fired into a sealed, rigid tank of known volume, and the internal pressure is recorded. Applying the ideal-gas law and accounting for the tank volume and gas temperature, the mass of gas in the tank at each time step is computed, and ṁ(t) is obtained by differentiation. This is why tank pressure traces are the canonical inflator characterization data — they encode the mass flow history.
Key relationship: For a rigid tank of volume Vtank, the instantaneous gas mass is m(t) = P(t)·Vtank / (R·T(t)). If the gas temperature is assumed to equal the tank wall temperature (a common simplification for slow tank tests), then ṁ(t) = (Vtank / R·T) · dP/dt. The slope of the tank pressure trace is therefore proportional to the mass flow rate.
3.3 Pressure–Volume–Temperature Behavior Inside the Cushion
Once gas enters the cushion, its state is governed by the ideal-gas law, P·V = m·R·T, where P is the absolute pressure, V is the instantaneous cushion volume, m is the gas mass, R is the specific gas constant, and T is the absolute temperature. In a deploying airbag, all four of these quantities change simultaneously and rapidly.
As the cushion unfolds, V increases from nearly zero to its full inflated volume — typically 60–120 L for a driver airbag, 100–200 L for a passenger airbag. If gas entered a perfectly sealed, rigid cushion, pressure would rise monotonically. Real cushions, however, are neither sealed nor rigid. Fabric stretches, seams leak, and — most importantly — the cushion is vented.
Temperature also evolves. Gas leaving a pyrotechnic inflator is hot; as it expands into the cushion it cools, and as it contacts cooler fabric it loses heat further. A common CAE simplification is to treat the inflation as isothermal at a reference temperature (e.g., 293 K), but this underestimates early-time pressure. More accurate models track energy balance explicitly, or use a polytropic relation P·Vn = constant with n between 1.0 (isothermal) and 1.4 (adiabatic).
3.4 Venting: The Controlled Leak That Shapes the Restraint
Venting is not a defect — it is a design feature. Without vents, the cushion would remain pressurized after deployment and behave like a rigid balloon, causing high rebound forces and potential injury. Vents — typically circular holes of 20–40 mm diameter, or fabric porosity — allow gas to escape so that the cushion absorbs occupant energy by controlled deflation.
The vent mass flow rate depends on the pressure difference across the vent, the vent area, and the discharge coefficient. For a vent discharging to atmosphere, the flow is choked when the pressure ratio Pcushion/Patm exceeds approximately 1.9 for air. In that regime, the mass flow rate is:
ṁ_vent = C_d · A_vent · P_cushion · sqrt( γ / (R·T) ) · ( 2 / (γ+1) )^((γ+1)/(2(γ-1)))

where:
  C_d      = discharge coefficient (typically 0.6–0.8 for fabric vents)
  A_vent   = total effective vent area [m²]
  P_cushion= absolute cushion pressure [Pa]
  γ        = ratio of specific heats (≈1.4 for air)
  R        = specific gas constant (≈287 J/(kg·K) for air)
  T        = gas temperature [K]
In CAE correlation, the vent discharge coefficient is one of the most sensitive tuning parameters. A 10% change in Cd can shift peak cushion pressure by 5–8%, which in turn changes occupant chest deflection predictions. This is why vent characterization — either by direct flow-bench measurement or by inverse fitting from tank and sled tests — is a critical step in model correlation.
3.5 Practical Implications for CAE Correlation
When a CAE model over-predicts peak cushion pressure, the cause is usually one of three things: the mass flow rate input is too high (tank test data misread or scaled incorrectly), the vent discharge coefficient is too low (venting under-predicted), or the gas temperature is treated as isothermal when the real inflation is closer to adiabatic. Conversely, under-prediction of early-time pressure often points to an over-estimated vent area or a mass flow curve that rises too slowly.
A practical correlation workflow begins with the tank test. The measured tank pressure trace is converted to ṁ(t) using the ideal-gas relation and the known tank volume. That ṁ(t) is then applied as the inlet boundary condition in the cushion model. The model's predicted cushion pressure is compared against a separate cushion pressure measurement — typically from a instrumented cushion or a rigid-wall test. If the traces diverge, the vent Cd is adjusted first, because it is the parameter with the clearest physical meaning and the least coupling to other inputs. Only after venting is matched should temperature or heat-transfer assumptions be revisited.
Correlation tip: Always verify that the tank test and the cushion test use the same inflator part number and the same conditioning temperature. Inflator output is strongly temperature-dependent — a hybrid inflator at −35 °C produces a noticeably different mass flow profile than at +85 °C. Mixing data from different conditioning states is a common and avoidable source of correlation error.
The physics described here — gas generation, mass flow, P-V-T evolution, and venting — forms the complete input set for any inflation CAE model. Mastering these relationships is what allows an engineer to move from "the model doesn't match" to "the model doesn't match because the vent discharge coefficient is 0.55 instead of 0.70, and here is the evidence."