1. Airbag inflation testing and CAE correla
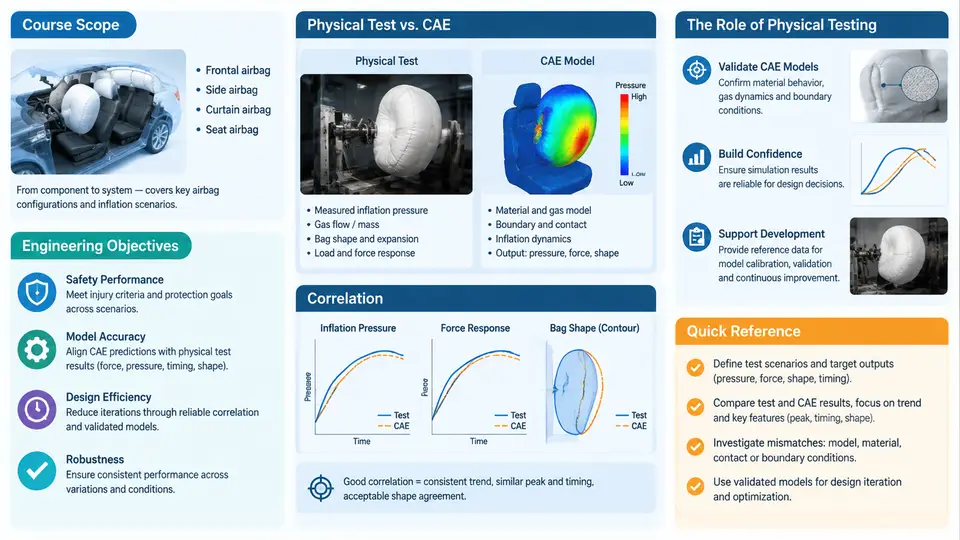
An airbag is a pyrotechnic restraint device that must deploy correctly within tens of milliseconds, once, with no opportunity for a second attempt. Because the deployment event is fast, energetic, and irreversible, engineers cannot rely on intuition or on simulation alone. The discipline of airbag inflation testing and CAE correlation exists to answer a single engineering question: does the numerical model reproduce the physical inflation event accurately enough that it can be trusted for design decisions? This chapter defines the scope of that discipline, states the engineering objectives, and explains why physical testing remains the anchor of restraint system development even in a heavily simulation-driven industry.
What the Discipline Covers
The scope spans three connected domains. The first is physical inflation testing: static deployment tests (also called tank or bench tests), dynamic sled tests, and full-vehicle crash tests, each instrumented to capture pressure, temperature, acceleration, and high-speed video. The second is CAE modeling: the construction of a validated finite element or corpuscular-particle model of the airbag, inflator, and surrounding structure, typically in an explicit solver such as LS-DYNA, PAM-CRASH, or Radioss. The third is correlation: the systematic comparison of simulated and measured responses, followed by parameter identification and model updating until the error falls within an accepted tolerance.
These three domains are not sequential steps that end; they form a loop. A model is correlated, used for a design study, and then re-validated when the hardware changes. The loop is the working unit of the discipline.
Engineering Objectives
Correlation work is not performed for its own sake. It serves four concrete objectives:
- Predictive confidence. A correlated model must predict occupant injury metrics — HIC, chest deflection, neck force — within a defined margin, so that design changes can be evaluated without building hardware for every variant.
- Design space exploration. Once trusted, the model can sweep inflator output, vent size, tether length, and fold pattern far faster and cheaper than physical iteration.
- Root-cause support. When a deployment anomaly appears — a torn seam, a late bag, an out-of-position interaction — the correlated model helps isolate whether the cause is inflator output, fabric permeability, or fold geometry.
- Regulatory and internal evidence. Correlation reports document that the CAE used for certification support is anchored to measured behavior, not assumption.
A useful way to state the objective quantitatively is through a correlation metric. For a pressure-time history, engineers commonly report the normalized root-mean-square error and the peak-value error:
NRMSE = sqrt( sum((P_sim(t) - P_test(t))^2) / N ) / (P_max_test - P_min_test)
Peak error (%) = (P_max_sim - P_max_test) / P_max_test * 100
Typical acceptance targets for a mature airbag model are NRMSE below roughly 10–15% over the inflation window and peak pressure error within ±5%. These are engineering conventions, not universal constants; the acceptable band depends on the sensor, the inflator variability, and the decision the model must support.
Why Physical Testing Remains Central
Three properties of airbag deployment make physical testing irreplaceable. First, the inflator is a stochastic pyrotechnic device. Gas output varies with propellant lot, temperature, and aging; a simulation that assumes a nominal mass-flow curve will miss the real spread. Testing at hot, nominal, and cold conditions (commonly +85 °C, +23 °C, and −35 °C) captures that spread and defines the envelope the model must bracket.
Second, fabric behavior is strongly nonlinear. Coated nylon permeability changes with pressure and strain rate, seams slip, and the bag unfolds through contact and self-contact that are difficult to model a priori. Bench tests with a rigid fixture isolate these effects in a way a full-vehicle test cannot.
Third, the event is a one-shot, high-rate process. There is no steady state to measure; the entire useful signal lasts 30–80 ms. Only instrumented testing can provide the time-resolved pressure and acceleration data that correlation requires.
The Correlation Workflow in Practice
A representative bench-test correlation for a driver-side airbag proceeds as follows. The bag and inflator are mounted in a rigid fixture inside a tank. Pressure transducers are placed at the module exit and at a defined distance from the bag surface; a high-speed camera records at 5,000–10,000 fps. The inflator is fired at the three temperature conditions, and each condition is repeated to establish repeatability.
On the CAE side, the model is built with the same geometry and boundary conditions. The inflator is represented either by a measured mass-flow-rate and temperature curve (a "tank curve") or by a simplified pressure-volume model. The fabric is modeled with a membrane or shell formulation, and permeability is applied as a pressure-dependent leakage. The simulation is run with the same time step and output intervals as the test.
Correlation then proceeds by comparing the pressure histories and the bag shape at matched times. If the simulated bag inflates too slowly, the mass-flow curve or the permeability is adjusted. If the peak pressure is too high, the vent area or the leakage coefficient is revisited. If the bag shape diverges late in the event, the fold pattern or the contact definition is the likely cause. Each adjustment is documented, and the model is re-run until the error metrics fall within target.
What a Correlation Deliverable Looks Like
The output of a correlation task is not a single number but a structured record. A practical correlation summary table for one inflator condition might contain the following fields, filled here with illustrative values that represent a plausible bench-test outcome rather than a measured result:
| Metric | Test (example) | Simulation (example) | Error | Target | Status |
|---|---|---|---|---|---|
| Peak pressure (kPa) | 245 | 252 | +2.9% | ±5% | Pass |
| Time to peak (ms) | 28 | 30 | +2 ms | ±3 ms | Pass |
| NRMSE over 0–60 ms | — | — | 11.4% | <15% | Pass |
| Bag width at 40 ms (mm) | 620 | 598 | −3.5% | ±5% | Pass |
| Cold-condition peak (kPa) | 198 | 214 | +8.1% | ±5% | Fail |
The cold-condition failure is the informative part. It tells the engineer that the model's temperature sensitivity is too weak — likely because the inflator mass-flow curve was scaled linearly with temperature rather than using the measured cold curve, or because fabric stiffness at low temperature was not updated. The corrective action is specific: replace the scaled curve with the measured cold-condition curve and re-run. This is the practical value of correlation: it converts a vague "the model is off" into a targeted parameter change.
How This Course Is Organized
The chapters that follow build the discipline in layers. Early chapters cover the physics of inflator output and fabric behavior, the instrumentation and data acquisition used in bench and sled tests, and the construction of the CAE model. Middle chapters address the correlation metrics, parameter identification methods, and the treatment of variability across temperature and inflator lot. Later chapters apply the correlated model to occupant interaction, out-of-position scenarios, and design optimization, and close with documentation and validation reporting practices.
The thread connecting all of them is the same: physical testing defines reality, CAE extends it, and correlation is the disciplined process that keeps the two honest with each other. A restraint system engineer who understands this loop can make design decisions with quantified confidence rather than hopeful assumption.