3. Correlation metrics for airbag performan
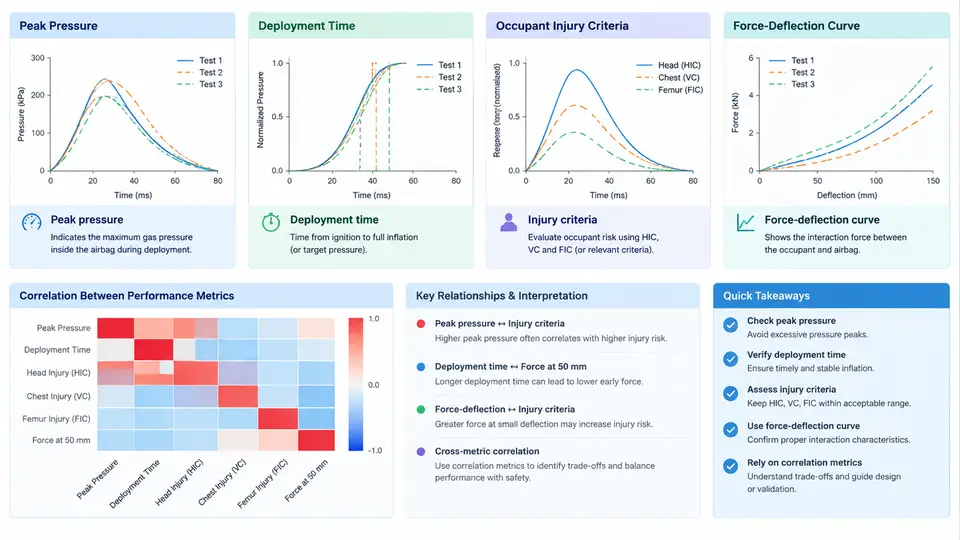
Correlation between a physical test and a CAE simulation is only as meaningful as the metrics used to quantify it. In airbag performance studies, four metric families dominate: peak pressure, deployment (time-to-fire) timing, occupant injury criteria, and force–deflection curves. Each captures a different physical layer of the restraint event, and each has its own correlation pitfalls. A robust robustness study treats them as a coordinated set rather than four independent scores.
Peak Pressure
Peak pressure is the maximum gauge pressure reached inside the inflator or cushion during deployment. It is a scalar, which makes it convenient for correlation, but also deceptive: two pressure histories with identical peaks can differ substantially in rise rate and total impulse. For correlation work, report peak pressure together with the time at which it occurs and the pressure at a fixed reference time (e.g., 30 ms).
A practical correlation metric is the normalized error:
e_peak = (P_sim_peak - P_test_peak) / P_test_peak * 100%Acceptance bands depend on the sensor location. Inflator-exit pressure typically correlates within ±10%, while cushion-interior pressure at the occupant-facing surface is more sensitive to fold pattern and venting, so ±15% is a realistic target. When the error exceeds the band, first check the tank-test boundary condition used to calibrate the inflator mass-flow curve; a mis-scaled mass flow will shift peak pressure without changing the shape.
Deployment Time
Deployment time is not a single number. The event chain includes time-to-fire (TTF, the electrical trigger), time-to-first-gas (TTFG, the pyrotechnic delay), and time-to-full-deployment (TTFD, when the cushion reaches its design envelope). Correlation should be reported at each milestone.
TTF is governed by the sensing and algorithm logic and is usually treated as a fixed input rather than a correlated output. TTFG and TTFD are the physically meaningful correlation targets. A common mistake is to correlate only TTFD; if TTFG is off by 2 ms, the entire pressure and force history shifts, and injury criteria computed on a fixed time base will show spurious errors.
*MAT_* activation time, subtract the known TTF offset before computing any timing error.Occupant Injury Criteria
Injury criteria are the ultimate correlation target because they define regulatory and consumer-rating pass/fail. The most common are HIC36 (or HIC15), chest deflection, chest acceleration (3 ms clip), and femur axial force. These are computed from the occupant response, not from the airbag itself, so they inherit errors from both the restraint model and the dummy model.
Correlation of injury criteria should be done on the time history, not only the scalar peak. A useful approach is to compute the peak value error and the phase error separately:
e_HIC   = (HIC_sim - HIC_test) / HIC_test * 100%
e_phase = t_peak_sim - t_peak_test   [ms]
For a driver-side frontal application, a reasonable correlation target is HIC within ±15% and phase within ±3 ms. If HIC correlates but phase does not, the airbag is likely too stiff or too slow; if phase correlates but HIC does not, the cushion pressure or venting is probably mis-tuned. This separation is what makes injury-criteria correlation diagnostic rather than merely descriptive.
Force–Deflection Curves
Force–deflection (F–D) curves describe the cushion's structural response as it is compressed. They are the richest correlation metric because they encode stiffness, energy absorption, and the transition from membrane to bottoming-out behavior. Unlike scalars, F–D curves require a shape-aware metric.
Two complementary metrics are recommended. First, the area error, which compares absorbed energy:
e_energy = (A_sim - A_test) / A_test * 100%, A = ∫ F dxSecond, the normalized root-mean-square deviation across the deflection range:
NRMSD = sqrt( Σ (F_sim(x_i) - F_test(x_i))² / N ) / (F_max_test - F_min_test)A well-correlated cushion typically shows energy error within ±10% and NRMSD below 0.15. The most common failure mode is a curve that matches in the first 40% of deflection but diverges near bottoming-out; this usually indicates an incorrect vent area or a fabric permeability that is too low at high pressure.
Putting the Metrics Together
The four metric families form a causal chain: inflator output drives cushion pressure, cushion pressure and geometry drive the F–D response, and the F–D response drives occupant loading and injury criteria. When correlation fails, the chain tells you where to look. A peak-pressure error points upstream to the inflator model; an F–D shape error points to the cushion; an injury-criteria phase error points to the interaction between cushion and occupant.
For a robustness study, each metric should be evaluated not only at the nominal design point but across the uncertainty space. A common practice is to compute the correlation error at the nominal point, then propagate input uncertainties (inflator mass flow, ambient temperature, fabric permeability, vent area) through a Design of Experiments or Monte Carlo sampling and record the distribution of each error metric. A design is considered robustly correlated when the 95th-percentile error remains inside the acceptance band, not merely when the nominal error is small.
Practical Correlation Checklist
| Metric | Primary Formula | Typical Target | First Diagnostic Check |
|---|---|---|---|
| Peak pressure | e_peak = (P_sim − P_test)/P_test | ±10% to ±15% | Inflator mass-flow scaling |
| Deployment time | ΔTTFG, ΔTTFD | ±2 ms per milestone | Trigger reference alignment |
| Injury criteria | e_HIC, e_phase | ±15%, ±3 ms | Separate peak vs. phase |
| Force–deflection | e_energy, NRMSD | ±10%, <0.15 | Vent area and permeability |
Applying these metrics consistently across the uncertainty space converts correlation from a one-time validation exercise into a continuous robustness indicator. The next step is to define how input uncertainties are sampled and how the resulting error distributions are interpreted against these acceptance bands.