3. Contact force measurement principles
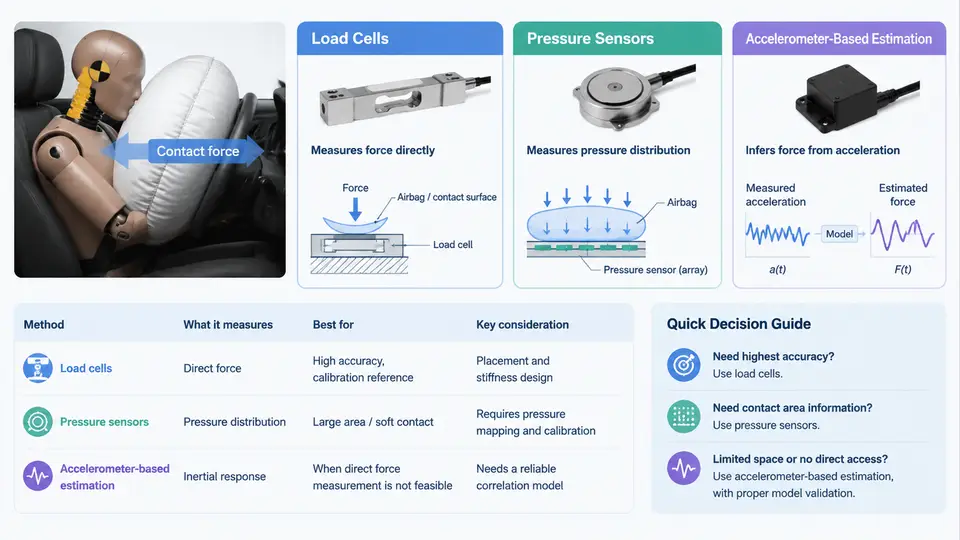
Airbag contact force is the resultant force exchanged between the deploying cushion and the occupant or the target object it strikes. Because this force is transient, spatially distributed, and often inaccessible once the airbag is packaged inside a module, no single sensor can capture it directly in every scenario. Practitioners therefore rely on three complementary measurement principles: load cells that measure reaction force at a mechanical interface, pressure sensors that infer force from the internal gas pressure of the cushion, and accelerometer-based estimation that reconstructs force from the inertia of a known mass. Understanding what each principle physically measures — and where its assumptions break down — is the foundation for any credible CAE correlation study.
Load Cells: Direct Reaction Force Measurement
A load cell converts a mechanical load into an electrical signal, most commonly through a strain-gauge Wheatstone bridge bonded to a compliant element. When the element deflects under load, the bridge becomes unbalanced and produces a millivolt-level differential output proportional to the applied force. For airbag testing, load cells appear in two dominant configurations.
In a static or quasi-static deployment rig, the airbag module is mounted on a rigid reaction plate instrumented with one or more load cells. The deploying cushion pushes against a target plate, and the load cells measure the reaction force transmitted through the mounting structure. This arrangement gives a direct, traceable force reading, but it measures only the resultant along the load cell axis. Off-axis components and moments are lost unless a multi-axis or triaxial load cell is used.
In a free-flight or pendulum impact setup, the load cell is mounted between the target plate and a stationary frame. The airbag strikes the plate, and the cell records the contact force history. Key practical considerations include:
- Rated capacity and overload: airbag deployment can produce peak forces well above steady-state expectations. A cell rated at 10 kN may see 25 kN transients; choose a capacity with at least 2–3× margin and verify the safe overload rating.
- Natural frequency: the cell's resonant frequency must be at least 5–10× the highest frequency of interest. For airbag events with meaningful content up to 1 kHz, a cell with a natural frequency above 5 kHz is advisable.
- Mounting stiffness: any compliance between the cell and the structure adds a series spring that filters the force signal. Rigid, preloaded bolted joints are essential.
- Cross-talk: in multi-cell arrays, verify that a load applied to one cell does not produce a spurious output in another.
A typical calibration check uses a known deadweight or a proving ring. If the cell output at 5 kN deviates by more than 1% from the reference, the bridge or cabling should be inspected before the test proceeds.
Pressure Sensors: Inferring Force from Cushion Pressure
An airbag cushion is a flexible pressure vessel. If the internal gauge pressure p(t) is known and the contact area A(t) between the cushion and the target is known or can be estimated, the contact force follows from:
F(t) = p(t) · A(t)Pressure sensors — typically piezoresistive or piezoelectric transducers — are mounted flush with the cushion fabric or on a small manifold connected to the inflator output. They are small, lightweight, and do not alter the cushion's structural response as much as a rigid load cell plate would. This makes them attractive for measuring the force delivered to a compliant or irregular target, such as an occupant surrogate.
The critical difficulty is A(t). The contact patch grows as the cushion inflates and deforms against the target. In a flat-plate test, A(t) can be approximated from high-speed video or from a pressure-sensitive film. In an occupant test, the contact area changes continuously and is rarely uniform, so the simple product p·A becomes an approximation. Common practice is to calibrate the pressure-to-force relationship empirically: run a series of tests with a load cell and a pressure sensor simultaneously, then fit a transfer function or a lookup table that maps measured pressure to measured force for that specific cushion-target combination.
Accelerometer-Based Estimation: Force from Inertia
When a known mass is accelerated by the airbag, Newton's second law provides a third route to contact force:
F(t) = m · a(t)Here m is the mass of the accelerated object (a headform, a torso block, or a free-flight plate) and a(t) is its measured acceleration. This method is conceptually simple and requires only a calibrated accelerometer mounted rigidly to the mass. It is widely used in drop-tower and linear-impact airbag tests.
The practical challenges are threefold. First, the accelerometer must be mounted so that its sensitive axis aligns with the force direction; misalignment introduces a cosine error. Second, the mass must be truly known and constant — any attached cabling, brackets, or instrumentation add to m and must be included. Third, the acceleration signal must be integrated or differentiated carefully: numerical differentiation amplifies high-frequency noise, so a low-pass filter with a cutoff chosen from the expected force spectrum is standard. A typical workflow is:
- Record acceleration at 20–50 kHz to capture the sharp airbag deployment transient.
- Apply a low-pass filter (e.g., 2–5 kHz) to remove sensor resonance and cable triboelectric noise.
- Multiply the filtered acceleration by the total accelerated mass to obtain force.
- Cross-check the integrated velocity change against high-speed video or a displacement sensor.
If the integrated velocity does not return to zero after the event (for a free-flight mass that should end at constant velocity), the accelerometer bias or the mass estimate is suspect.
Choosing and Combining the Three Principles
No single method is universally superior. The table below summarizes the trade-offs that drive sensor selection in airbag contact force testing.
| Principle | What It Measures | Key Strength | Primary Limitation |
|---|---|---|---|
| Load cell | Reaction force at a mechanical interface | Direct, traceable, high accuracy | Requires rigid mounting; measures only along its axis |
| Pressure sensor | Internal cushion gauge pressure | Non-intrusive; captures pulse timing | Needs contact area A(t); absolute force is approximate |
| Accelerometer | Acceleration of a known mass | Simple; works in free-flight setups | Requires accurate mass and filtering; sensitive to mounting |
In a well-designed correlation study, at least two principles are used simultaneously. For example, a load cell on the reaction plate provides the reference force, while a pressure sensor inside the cushion records the inflation history. The accelerometer on the target mass gives an independent check. When the three signals agree within a defined tolerance — typically 5–10% on peak force and 1–2 ms on peak timing — the measurement chain is considered validated, and the data can be used with confidence to calibrate or correlate a CAE model.
Signal Chain and Data Quality Checks
Regardless of the sensing principle, the signal chain from sensor to recorded data introduces its own artifacts. A typical chain includes the sensor, a charge or voltage amplifier, an anti-aliasing filter, the digitizer, and the recording software. Each stage can distort the force history. Practical checks include:
- Pre-test calibration: apply a known shunt resistor or a calibrated force to verify the entire chain, not just the sensor.
- Zero-offset verification: record a few seconds of pre-trigger data. A drifting baseline indicates thermal or charge leakage problems.
- Sampling rate: use at least 10× the highest frequency of interest. For airbag contact force, 20–50 kHz is common.
- Filter transparency: document the filter type, order, and cutoff. A 4th-order Butterworth at 2 kHz is a frequent choice, but the phase lag it introduces must be accounted for when comparing to CAE results.
The SVG below illustrates the three measurement principles applied to a common airbag deployment scenario, showing where each sensor sits in the physical setup and what signal it produces.
The figure shows the physical arrangement on the left, the signal transformation for each principle in the middle, and a qualitative comparison of the resulting force histories on the right. In practice, the load cell curve is treated as the reference; the pressure-derived and accelerometer-derived curves are overlaid to check peak magnitude, rise time, and pulse duration. A consistent offset in peak timing between the load cell and the accelerometer often points to a mounting resonance or a filter-induced phase lag, while a magnitude discrepancy in the pressure-derived curve usually indicates an error in the assumed contact area.
When preparing data for CAE correlation, always record the raw sensor signals alongside the processed force histories. The raw data allows the correlation engineer to re-filter or re-scale the signals if the initial processing assumptions prove inconsistent with the simulation. Documenting the sensor model, serial number, calibration date, amplifier gain, filter settings, and sampling rate for each channel is not administrative overhead — it is the evidence that makes the correlation defensible.