1. Airbag contact force testing and CAE cor
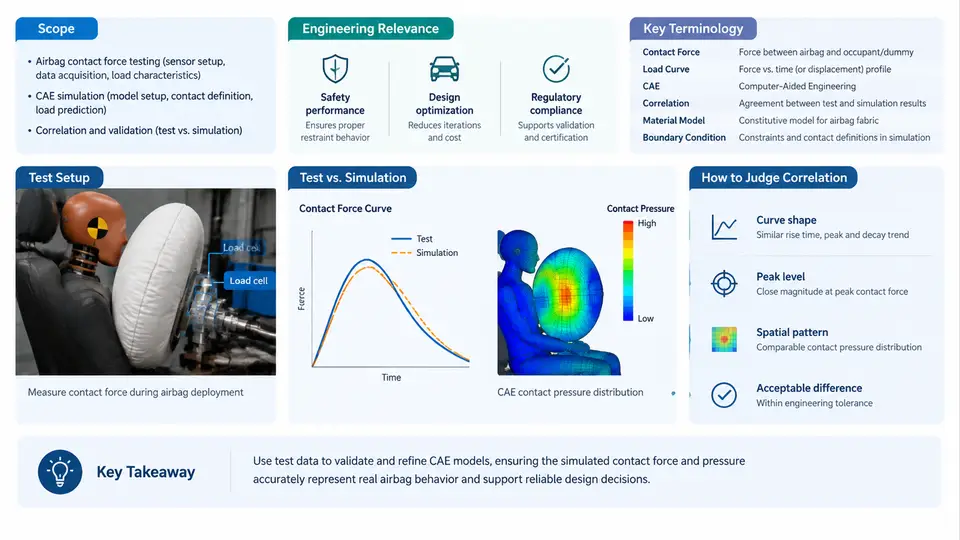
Airbag deployment is one of the most violent events a vehicle occupant experiences. Within roughly 20 to 50 milliseconds, an inflator releases gas that unfolds a fabric cushion and drives it toward the occupant at speeds that can exceed 200 km/h at the cushion face. The force the cushion transfers to the occupant — the airbag contact force — determines whether the restraint system protects or injures. This course addresses how that force is measured in physical testing, how it is predicted in CAE (Computer-Aided Engineering), and how the two are correlated so that simulation models can be trusted for design decisions.
What This Course Covers
The course spans the full workflow from test setup to validated simulation. The major blocks are:
- Measurement fundamentals — sensor selection, load cell and pressure transducer placement, data acquisition bandwidth, and filtering.
- Test configurations — static deployment (airbag firing into a fixed plate or a surrogate occupant), dynamic sled tests, and full-vehicle crash tests.
- CAE modeling — airbag folding, inflator gas modeling (mass flow rate and temperature curves), fabric material models, and contact definitions.
- Correlation methodology — objective metrics, tolerance bands, parameter identification, and model updating.
- Application cases — occupant out-of-position (OOP) scenarios, adaptive restraint tuning, and regulatory compliance.
The unifying thread is the contact force signal: it is the primary physical quantity that both the test and the simulation must reproduce, and it is the quantity that directly relates to occupant injury criteria such as chest deflection and head acceleration.
Why Contact Force Correlation Matters in Engineering
Regulatory and consumer-rating programs — FMVSS 208, ECE R94, Euro NCAP, C-NCAP — impose occupant injury limits that are evaluated in physical tests. A CAE model that does not reproduce the contact force history cannot reliably predict those injury values, which means the model cannot be used to reduce the number of physical tests. Since a single full-vehicle crash test costs tens of thousands of dollars and consumes a vehicle, the economic incentive to build a trustworthy model is substantial.
Beyond cost, correlation matters for safety margin. If the simulated contact force is 15% lower than the measured force at the chest, the model will under-predict chest deflection and may approve a design that fails in reality. Conversely, an over-predicting model leads to over-conservative designs that add mass and cost. Accurate correlation keeps the design in the narrow band between safe and efficient.
Key Terminology
The following terms appear throughout the course and are defined here with the specific meaning used in airbag contact force work.
| Term | Definition and context |
|---|---|
| Contact force | The resultant force transmitted between the airbag cushion and the occupant or test device, typically measured by a load cell or derived from pressure and area. |
| Inflation pressure (Pbag) | Internal cushion pressure, measured by a pressure transducer. Contact force is often approximated as Pbag × Acontact, where Acontact is the instantaneous contact area. |
| Mass flow rate (ṁ) | The rate at which gas enters the cushion from the inflator, a primary input to the CAE inflator model. Units: kg/s. |
| OOP (Out-of-Position) | An occupant posture close to the airbag module at deployment, producing the highest and most variable contact forces. |
| Correlation metric | A numerical measure of agreement between test and simulation curves, e.g., peak force error, phase shift, or a composite score such as CORA. |
| Tolerance band | An envelope around the test signal within which the simulation is considered acceptable, often defined as ±10% of peak or a time-dependent corridor. |
| Model updating | The process of adjusting uncertain CAE parameters (fabric permeability, vent size, inflator rise rate) to minimize the correlation error. |
How Test and Simulation Connect
The correlation workflow is not a single step but a loop. A physical test produces a contact force history Ftest(t). The CAE model produces FCAE(t). The two are compared, discrepancies are traced to specific model parameters, and those parameters are updated. The loop repeats until the correlation metric falls inside the tolerance band.
The SVG below shows the signal chain from inflator to occupant, with the measurement points and the corresponding CAE inputs. It is a signal-flow and measurement-topology diagram, not a process flowchart: it answers "where is the force generated, where is it measured, and what does the model need to reproduce it."
Reading the Diagram
The top row is the physical domain: the inflator generates gas, the cushion inflates and contacts the occupant, and the load cell records the force. The bottom row is the simulation domain: the CAE model takes the inflator mass flow curve and fabric properties as inputs and produces its own contact force prediction. The correlation block compares the two signals and, when the error exceeds the tolerance band, feeds parameter updates back into the model.
Two practical points follow from this structure. First, the inflator mass flow rate is the single most influential input for the early phase of the contact force curve (0–15 ms). If the test and simulation diverge in this window, the inflator model is the first suspect. Second, the cushion pressure and contact area govern the later phase (15–40 ms); divergence here points to fabric permeability, vent sizing, or contact stiffness.
What Good Correlation Looks Like
In a well-correlated model, the simulated contact force curve matches the measured curve in four respects: peak force magnitude, time-to-peak, curve shape during the plateau, and decay behavior. A typical acceptance criterion for occupant-facing contact force is a peak error within ±10% and a time-to-peak error within ±2 ms. These are example targets, not universal constants; the actual tolerance depends on the program and the injury criterion being evaluated.
Course Approach and Expectations
Each chapter builds on the terminology and signal chain introduced here. You will work with real parameter values — inflator mass flow curves in kg/s, fabric permeability in l/(dm²·min), vent hole diameters in mm — and you will see how a change in each parameter propagates to the contact force curve. The goal is not to memorize definitions but to develop the judgment to look at a mismatched curve and know which parameter to adjust.
By the end of the course, you should be able to set up a contact force measurement, build or review a CAE airbag model, compute correlation metrics, and decide whether a model is fit for its intended purpose. That decision — fit for purpose — is the ultimate engineering deliverable of correlation work.