1. Airbag system fundamentals for CAE
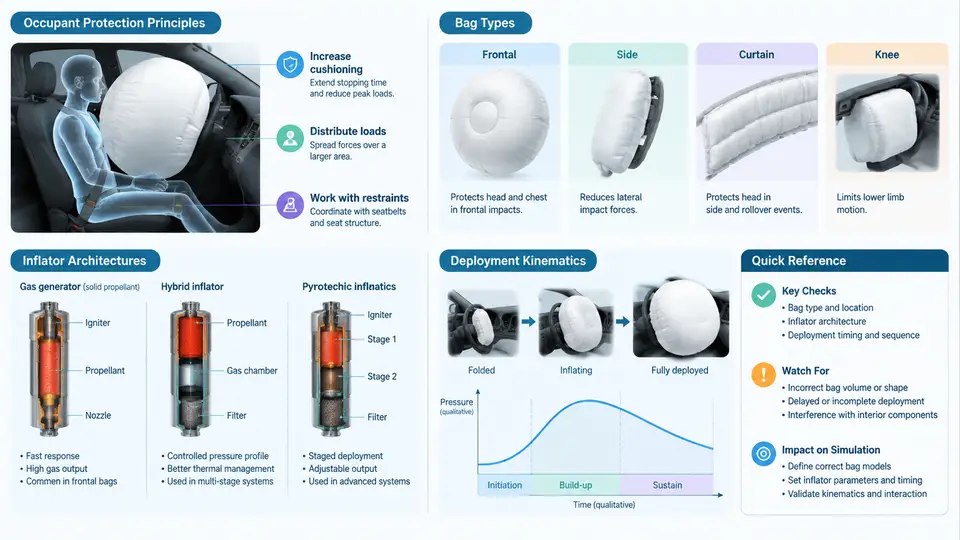
An airbag is not a single product but a pyrotechnically triggered energy-management system. For the CAE engineer, the practical consequence is that a deployment simulation must reproduce three coupled domains at once: the gas source (inflator), the compliant structure (cushion fabric and seams), and the moving occupant. Getting any one of them wrong produces a result that looks plausible in an animation but is quantitatively useless for restraint tuning. This chapter establishes the physical and architectural vocabulary that every later modelling decision depends on.
Occupant protection principle
The airbag does not "catch" the occupant. It converts a short, high-severity deceleration of the chest and head against hard interior surfaces into a longer, lower-magnitude deceleration distributed over a compliant membrane. The governing relation is the impulse–momentum balance:
F_avg · Δt = m · Δv

m      occupant effective mass (kg)
Δv     relative velocity at contact (m/s)
Δt     ride-down duration (s)
F_avg  average restraint force (N)
Because Δv is fixed by the crash pulse, the only lever the restraint designer has is Δt. A cushion that is fully inflated and vented correctly stretches the interaction from roughly 10–15 ms (hard contact) to 60–90 ms (ride-down). Two failure modes bracket the design: too stiff (high internal pressure, insufficient venting) raises F_avg and can cause chest deflection or head injury criterion (HIC) excursions; too soft or too late lets the occupant reach the "bottom-out" condition where the head strikes the steering wheel or instrument panel through a deflated bag. In CAE terms, the interesting output is therefore not peak pressure but the pressure–time and force–displacement history at the occupant interface.
Bag types and their simulation signatures
Bag architecture determines the meshing strategy, the contact definition, and the type of validation data you can expect.
| Type | Typical volume | Key modelling feature | Primary CAE risk |
|---|---|---|---|
| Driver frontal | 60–80 L | Single chamber, tethers, vent holes | Vent flow coefficient calibration |
| Passenger frontal | 100–140 L | Larger fabric area, seam rupture | Seam failure modelling |
| Side torso | 12–20 L | Fast fill, small volume, door trim contact | Fill-time sensitivity |
| Curtain | 25–40 L | Elongated, roof-rail mounting, low pressure | Anchorage and coverage geometry |
| Knee bolster | 15–25 L | Load-path to lower extremities | Contact stiffness with tibia |
Each type imposes a different dominant physics. A curtain bag is essentially a pressure-vessel problem with large membrane deformation; a side torso bag is a transient fill problem where the inflator's first 5 ms dominate the outcome. Treating them with the same modelling template is a common source of error.
Inflator architectures
Three architectures dominate production vehicles, and each has a distinct mass-flow characteristic that must be entered into the simulation.
- Pyrotechnic — solid propellant burns to produce gas. Mass flow rises sharply and decays; total fill time is short (20–40 ms for a driver bag). The input is a burn-rate curve, often supplied as a tank-test pressure trace.
- Hybrid — a small pyrotechnic charge heats stored compressed gas (argon/helium). The flow is more sustained and cooler, giving a longer, flatter pressure plateau.
- Stored-gas (cold gas) — used mainly in side and curtain systems where a fast, clean fill is needed. Flow is governed by the burst-disc opening and the reservoir pressure.
In practice, the inflator is characterised by a tank test: the inflator fires into a fixed-volume vessel and the pressure history is recorded. The CAE engineer converts that trace into a mass-flow rate using the ideal-gas relation, then feeds it to the uniform-pressure (UP) or computational-fluid-dynamics (CFD) gas model. The conversion is:
dm/dt = (V / (R · T)) · dP/dt

V   tank volume (m³)
R   specific gas constant (J/kg·K)
T   gas temperature (K)
P   measured tank pressure (Pa)
If the tank-test trace is unavailable, a first-order approximation using a constant mass flow over the fill window is acceptable for a scoping study but must be flagged as an assumption, not a validated input.
Deployment kinematics
Deployment is a sequence of distinct mechanical events, and each maps to a modelling decision:
- Initiation (0 ms) — the crash sensor closes the circuit. In simulation this is the trigger time; a 5–10 ms delay is typical for the sensing and firing chain.
- Inflator discharge (0–30 ms) — gas enters the cushion. The cushion unfolds from its packed state; the fabric's initial fold pattern governs the early trajectory.
- Unfolding and tether engagement (10–40 ms) — the bag expands along its designed path. Tethers limit excursion and shape the final geometry.
- Full inflation and venting (30–60 ms) — internal pressure peaks, then vents through the fabric porosity and vent holes as the occupant loads the bag.
- Occupant interaction (40–100 ms) — the bag deforms, pressure rises again, and the ride-down phase begins.
The critical CAE insight is that the fold pattern is not cosmetic. A star-fold versus a rolled-fold changes the initial contact area and the direction of the unfolding front, which in turn changes the timing of occupant contact. Most production simulations therefore start from a folded mesh generated by a dedicated folding tool, not from a hand-built geometry.
What this means for the simulation setup
The chain above is not merely descriptive — it dictates the order in which a model should be built and validated. A defensible workflow is:
- Establish the crash pulse and the occupant position from the sled or full-vehicle test.
- Convert the tank-test pressure trace into a mass-flow curve and verify it against a standalone inflator-only simulation.
- Import or generate the folded cushion mesh and confirm that the unfolding front matches high-speed video from a static deployment test.
- Calibrate the vent coefficient and fabric permeability against a static deployment pressure trace.
- Only then couple the occupant model and evaluate injury criteria.
Skipping step 2 or 3 is the most frequent cause of a model that converges but predicts the wrong contact timing. If the cushion reaches the occupant 10 ms late, the head will have already passed the bag's centreline, and no amount of contact-stiffness tuning will recover the correct HIC.
Reference values for scoping
The following table collects representative values for a driver frontal system. They are intended for initial model setup and sanity checking, not as validated design data.
| Parameter | Representative value | Typical CAE source |
|---|---|---|
| Cushion volume (driver) | 60–80 L | CAD / folded mesh |
| Fill time to 90% volume | 25–35 ms | Tank test + mass-flow curve |
| Peak internal pressure | 180–250 kPa (gauge) | Static deployment test |
| Vent hole diameter | 25–40 mm (two holes) | CAD |
| Fabric permeability | 5–20 L/dm²/min at 500 Pa | Material datasheet |
| Trigger delay | 5–10 ms | Sensor calibration |
| Occupant ride-down window | 60–90 ms | Sled test correlation |
With this vocabulary in place — protection principle, bag type, inflator architecture, and the deployment timeline — the next step is to translate each element into a concrete modelling object: a gas model, a fabric material, a contact definition, and a trigger. The remainder of this course builds those objects one at a time and validates them against the physical evidence described here.