3. Inflator performance characterization
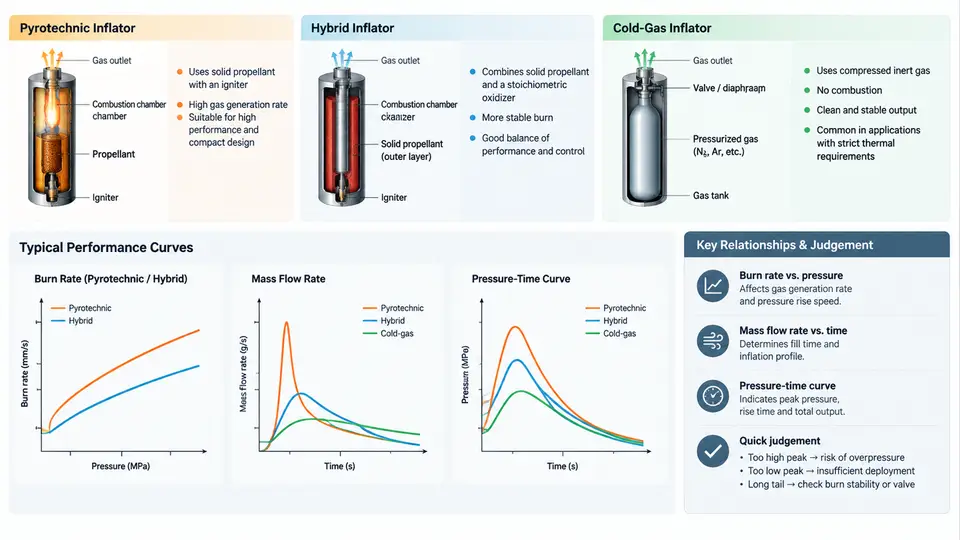
The inflator is the energy source of the airbag system. Its output determines how fast the cushion fills, how the bag pressurizes the occupant, and whether the restraint performs correctly across the full temperature and severity range. Characterizing inflator performance therefore means quantifying three coupled quantities: the burn rate of the energetic material, the mass flow delivered to the cushion, and the resulting pressure–time curve inside a fixed-volume tank. This chapter explains how the three inflator families differ, how each quantity is measured, and how to read a tank curve as an engineering signature of the device.
Three Inflator Architectures
Pyrotechnic inflators burn a solid propellant — typically sodium azide-based in legacy designs, or non-azide guanidine nitrate / ammonium nitrate formulations in modern units. Gas is generated entirely by the exothermic decomposition of the grain. Output is fast and the hardware is compact, but gas temperature is high (often above 1000 °C at the nozzle) and the effluent contains particulates that must be filtered.
Hybrid inflators combine a small pyrotechnic initiator/booster with a stored compressed gas, usually argon or helium at 20–40 MPa. The burning propellant heats the stored gas, raising its pressure and therefore the delivered mass flow. This yields a cooler, cleaner gas than a pure pyrotechnic device and allows the pressure–time profile to be tuned by the ratio of stored gas to propellant.
Cold-gas inflators release compressed gas only, with no combustion. They are common in side airbags, pedestrian protection systems, and some seatbelt pretensioners. Because there is no exothermic reaction, the gas stays near ambient temperature, but the stored pressure and orifice area alone must supply the required mass flow, which limits total gas output.
Burn Rate and Its Pressure Dependence
For a solid propellant, the linear burn rate r is commonly described by Vieille's law:
r = a · P^nwhere P is the combustion chamber pressure, a is a temperature-dependent constant, and n is the pressure exponent. A low exponent (n ≈ 0.2–0.5) gives a relatively flat burn rate versus pressure, which is desirable for stable, repeatable output. A high exponent makes the burn rate sensitive to pressure excursions and can produce unstable combustion. Burn rate is measured in a closed bomb or a Crawford bomb, where a small propellant sample is ignited in a sealed vessel and the pressure rise is recorded. The slope of the pressure–time trace during the burn, combined with the known vessel volume and propellant mass, yields r at each pressure.
Burn rate directly sets the gas generation rate. If the grain geometry and burn area are known, the mass generation rate is:
ṁ_gen = ρ_p · A_b · rwhere ρ_p is propellant density and A_b is the instantaneous burning area. This is the source term that drives the entire downstream pressure and flow behavior.
Mass Flow Through the Nozzle
Gas leaves the inflator through one or more orifices or a nozzle. For choked flow — the normal condition when chamber pressure is much higher than cushion pressure — the mass flow rate is:
ṁ = C_d · A_t · P_c / √(R · T_c) · √(γ · (2/(γ+1))^((γ+1)/(γ-1)))Here C_d is the discharge coefficient, A_t the throat area, P_c and T_c the chamber pressure and temperature, R the specific gas constant, and γ the ratio of specific heats. The practical consequence is that mass flow scales linearly with chamber pressure and throat area, and inversely with the square root of gas temperature. This is why hybrid inflators, which heat stored gas, can deliver more mass flow than a cold-gas unit of the same orifice size.
Reading a Tank Pressure–Time Curve
The standard characterization test fires the inflator into a sealed tank of known volume (commonly 60 L or 100 L) and records pressure versus time. The curve has a characteristic shape: a short delay, a steep rise as the propellant burns, a peak, and then a decay as gas cools and leaks. Key metrics extracted from the curve include:
- Time to 10% and 90% of peak pressure — indicates how quickly the bag begins to inflate and how fast it reaches full deployment.
- Peak pressure (P_max) — proportional to total gas moles delivered and inversely related to tank volume.
- Time to peak (t_max) — the burn duration plus flow transit time.
- Area under the curve — proportional to total impulse delivered to the cushion.
Because the tank is closed, the pressure–time curve is a direct fingerprint of the inflator's mass and energy output. Two inflators with the same peak but different rise times will produce very different occupant loading, even though their total gas output is similar.
Comparing the Three Families
| Attribute | Pyrotechnic | Hybrid | Cold gas |
|---|---|---|---|
| Gas source | Propellant combustion | Propellant + stored gas | Stored gas only |
| Gas temperature | High (>1000 °C) | Moderate (200–600 °C) | Near ambient |
| Mass flow control | Grain geometry + orifice | Propellant/stored-gas ratio | Orifice + stored pressure |
| Typical rise time | Very fast (<20 ms) | Fast (20–40 ms) | Moderate (30–60 ms) |
| Particulate output | High, requires filter | Low to moderate | None |
| Common applications | Driver frontal | Passenger frontal, side | Side, pedestrian, pretensioner |
Practical Characterization Procedure
To characterize an inflator for a design study, follow a repeatable sequence. First, condition the unit to the test temperature — typically −35 °C, 23 °C, and 85 °C — because burn rate and stored-gas pressure are both strongly temperature-dependent. Second, mount the inflator in the tank with the nozzle directed away from the pressure transducer to avoid direct impingement. Third, fire and record pressure at a sampling rate of at least 10 kHz so that the rise is resolved. Fourth, extract P_max, t_max, rise time, and impulse. Fifth, repeat at each temperature and compare the curves.
Typical failure symptoms and their interpretation: a slow rise with a low peak suggests propellant degradation or a blocked orifice; a very sharp spike followed by rapid decay suggests grain cracking or an oversized throat; a curve that is normal at 23 °C but weak at −35 °C indicates excessive temperature sensitivity of the burn rate. Each symptom points to a specific design or quality issue that can be addressed by reformulating the propellant, resizing the orifice, or changing the stored-gas pressure.
The figure above summarizes the characterization chain: the inflator type determines the gas source and temperature, the burn rate and orifice set the mass flow, and the tank test converts that mass flow into a pressure–time signature from which the performance metrics are extracted. In practice, the tank curve is the single most useful diagnostic because it integrates every upstream design choice — propellant formulation, grain geometry, orifice size, and stored-gas condition — into one measurable output.