3. Material characterization for weld failu
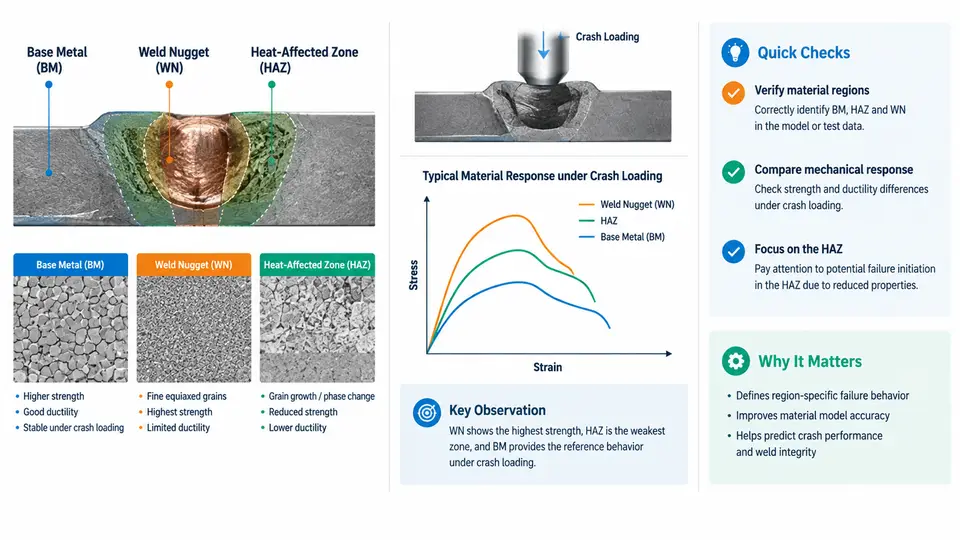
A spot weld is not a single material. It is a small, heterogeneous metallurgical system consisting of at least three distinct zones: the base metal (BM), the heat-affected zone (HAZ), and the weld nugget (fusion zone). Each zone has different yield strength, hardening behavior, ductility, and strain-rate sensitivity. In a crash simulation, the accuracy of the predicted failure mode — interfacial pull-out, nugget pull-out, or base-metal tearing — depends directly on how well these three zones are characterized and represented in the material cards.
This section explains what each zone is, how its properties are obtained, and how those properties are transferred into a PAM-CRASH weld model.
Why the Three Zones Behave Differently
Resistance spot welding applies current and pressure through copper electrodes. The rapid heating and subsequent cooling produce a sharp thermal gradient. The result is a characteristic hardness profile across the weld, often measured with a microhardness traverse.
- Base metal: unaffected parent sheet, with the original cold-rolled or bake-hardened microstructure. It typically has the lowest hardness in mild steels but the highest ductility.
- Heat-affected zone: heated above the transformation temperature but not melted. It may harden (martensite formation in AHSS) or soften (temper softening in DP and martensitic steels). The HAZ is often the weakest link in advanced high-strength steels.
- Weld nugget: fully melted and resolidified. It is usually the hardest zone, with a cast dendritic structure, but it can be brittle and sensitive to porosity and electrode indentation.
Under crash loading, strain rates reach 102–103 s-1. The relative strength ranking of the three zones can change with strain rate, so quasi-static hardness data alone is insufficient.
Base Metal Characterization
The base metal is characterized first because it defines the reference for the other zones. For crash simulation, the essential inputs are:
- Quasi-static true stress–strain curve up to fracture (from ASTM E8 tensile tests).
- Dynamic stress–strain curves at 1, 10, 100, and 1000 s-1 (split Hopkinson bar or high-speed servo-hydraulic testing).
- Strain-rate sensitivity parameters for a Johnson–Cook or Cowper–Symonds model.
- Failure strain or a damage-initiation criterion (e.g., Johnson–Cook fracture, GISSMO).
For a typical DP590 sheet, an illustrative set of parameters might be: yield strength 380 MPa, ultimate tensile strength 590 MPa, uniform elongation 18%, and a Cowper–Symonds D = 40, p = 5. These are example values for teaching, not measured data.
Heat-Affected Zone Characterization
The HAZ is the most difficult zone to characterize because it is narrow (0.5–2 mm) and has a steep property gradient. Two practical approaches are used:
- Sub-size tensile specimens: Specimens are extracted from the HAZ using electro-discharge machining or laser cutting. The gauge length must be small enough to stay within the HAZ. This gives a direct stress–strain curve but is sensitive to alignment and edge quality.
- Hardness-to-strength correlation: Microhardness maps are converted to local yield strength using empirical correlations (e.g.,
YS ≈ 3.0 × HVfor steels). This is faster and captures the gradient, but it does not give ductility or strain-rate sensitivity directly.
In PAM-CRASH, the HAZ is often represented as a ring of shell elements around the nugget with a reduced thickness or a modified material card. If the HAZ is softer than the base metal (common in DP780 and above), the model must allow strain localization there. If it is harder but brittle (common in martensitic steels), a lower failure strain must be assigned.
Weld Nugget Characterization
The nugget is small and hard, and its properties are usually obtained indirectly. The most common methods are:
- Shear tests: Lap-shear and cross-tension specimens loaded to failure. The measured peak force and displacement are used to calibrate the nugget failure criterion.
- Nugget hardness: Converted to strength using the same correlation as the HAZ. Nugget hardness in DP590 is typically 350–450 HV, corresponding to roughly 1000–1400 MPa tensile strength.
- Metallographic measurement: Nugget diameter and penetration are measured from etched cross-sections. These geometric values feed directly into the weld element size and the force-based failure criterion.
For a 6 mm nugget in 1.5 mm DP590 sheets, an illustrative calibration might yield a peak shear force of 12–14 kN and a critical displacement of 1.5–2.0 mm. Again, these are example values for demonstration.
Transferring Properties into PAM-CRASH
PAM-CRASH offers several weld representations. The choice affects how the three zones are modeled:
| Weld Model | Zones Represented | Typical Use |
|---|---|---|
| Spot weld element (rigid or elastic-plastic) | Nugget only; BM and HAZ are in the sheet mesh | Full-vehicle crash with many welds |
| Solid nugget + HAZ ring | All three zones explicitly | Component-level weld failure studies |
| Cohesive zone model | Interface behavior, calibrated from lap-shear | Detailed failure-mode prediction |
When using a spot weld element, the material card for the weld element should use nugget properties, while the surrounding sheet elements use base-metal and HAZ properties. The failure criterion is typically force-based or displacement-based, calibrated from the lap-shear and cross-tension tests described above.
Strain-Rate Effects and Temperature
Crash loading is not isothermal. Localized heating at the weld can reach 100–200°C in high-rate tests. For most body-in-white steels, thermal softening is secondary to strain-rate hardening, but for the HAZ in AHSS, the combination can be significant. If the material card supports temperature-dependent parameters, use them. If not, calibrate the failure criterion at the expected strain rate rather than at quasi-static conditions.
A practical workflow for characterizing a weld for crash simulation is:
- Measure base-metal quasi-static and dynamic stress–strain curves.
- Perform microhardness traverse across the weld and convert to strength.
- Extract HAZ and nugget properties using sub-size tests or correlation.
- Calibrate the weld failure criterion using lap-shear and cross-tension tests.
- Build the PAM-CRASH model with appropriate zone assignment and mesh refinement.
- Validate against a component-level test (e.g., a hat-section axial crush or a three-point bend).
The key insight is that weld failure is not a single material property. It is the result of competition between three zones with different strengths, ductilities, and strain-rate sensitivities. Characterizing all three — and assigning them correctly in the model — is what separates a predictive crash simulation from a qualitative one.