1. Course overview
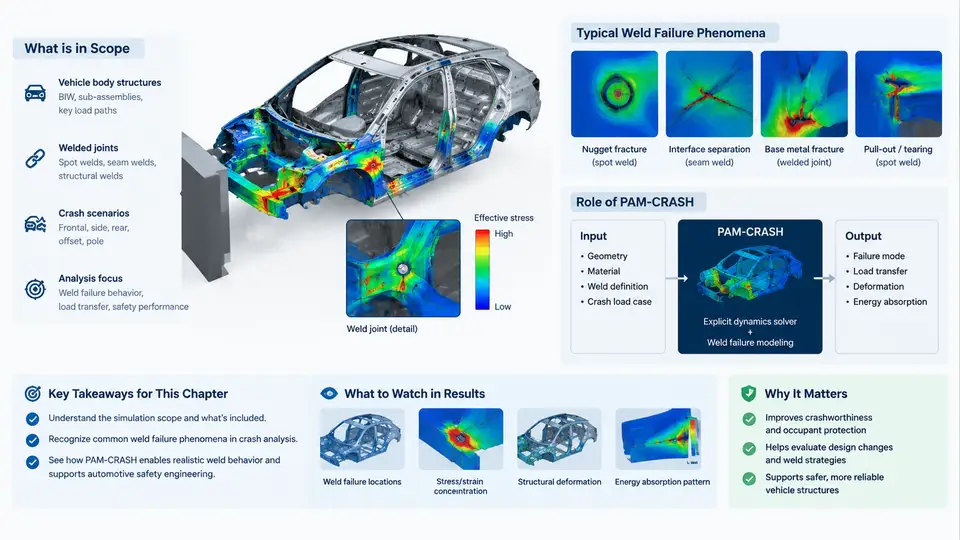
Spot-welded joints are the most numerous structural connections in a steel or mixed-material body-in-white (BIW). A typical passenger car body contains 3,000–5,000 resistance spot welds, plus a smaller number of laser welds, MIG/MAG seams, structural adhesives, and self-piercing rivets. During a crash event, these joints must transfer shear, peel, and combined loads between stamped panels while the surrounding sheet metal folds, stretches, and tears. When a weld fails prematurely, the load path it carried is redistributed to neighboring joints and to the base metal, which can change the entire deformation mode of the structure. This course is about predicting that behavior numerically, understanding why the prediction is difficult, and using PAM-CRASH effectively to support real automotive safety engineering decisions.
Why weld failure dominates crash simulation credibility
In a full-vehicle frontal or side impact simulation, the global metrics that engineers care about — intrusion into the occupant compartment, B-pillar bending angle, rocker panel deformation, and the resulting dummy injury criteria — are strongly influenced by how the joint network behaves. Two simulations with identical mesh, identical material cards, and identical boundary conditions can produce intrusion differences of 20–50 mm purely because of different weld failure models. This sensitivity is the reason weld modeling is treated as a first-class topic rather than a meshing detail.
The physical phenomena that must be represented include:
- Nugget pull-out — the weld button remains intact but tears a plug from the parent sheet, typically under peel-dominated loading.
- Interfacial fracture — separation occurs at the faying surface with little or no nugget pull-out, common in high-strength steels and under shear-dominated loading.
- Base metal failure — the heat-affected zone (HAZ) softens or the sheet tears adjacent to the weld; the joint itself survives.
- Partial pull-out and mixed modes — combinations of the above, which are the most common in real crash events.
- Weld expulsion and porosity — manufacturing defects that reduce effective nugget diameter and shift the failure mode.
Each of these mechanisms has a different dependence on loading angle, strain rate, sheet thickness, and material grade. A model that captures only shear strength will over-predict joint survival in peel-dominated regions such as the front rail-to-apron connection or the B-pillar-to-rocker joint.
What PAM-CRASH provides
PAM-CRASH is an explicit finite element solver widely used in the automotive industry for crashworthiness, occupant safety, and impact simulation. Its relevance to weld failure comes from several capabilities that are used together:
- Dedicated connection elements — spot welds are represented by specialized elements (e.g.,
PLASTIC_WELD,SPOT_WELD, or solid/beam representations) with their own constitutive and failure laws, rather than being approximated by rigid links. - Rate-dependent material models — sheet steels and welds are strain-rate sensitive; PAM-CRASH material cards (e.g.,
MAT_103,MAT_124,MAT_36) allow rate-dependent plasticity and failure strain input. - Robust contact handling — self-contact and inter-panel contact after weld rupture must remain stable; PAM-CRASH contact algorithms and penalty stiffness controls are tuned for this.
- Explicit time integration — suitable for the large deformation, high-velocity, highly nonlinear event that a crash is.
- Coupling with occupant and restraint models — the structural result feeds dummy and airbag models in the same or a coupled run.
The solver does not decide whether a weld should fail; the engineer does, through the choice of element type, failure criterion, and calibrated parameters. PAM-CRASH provides the framework and the numerical robustness to execute that decision consistently.
Where weld failure appears in the crash simulation workflow
The diagram below shows the position of weld failure modeling within a typical BIW crash simulation chain, from CAD and joining data through to the engineering decision. It is not a software menu map; it is the data and decision flow that determines whether the final intrusion prediction is trustworthy.
Scope of this course
The course is organized around the practical decisions an engineer must make when weld failure matters to the result. It covers:
- Weld types and failure mechanisms in BIW structures, and how they map to simulation representations.
- Element and material modeling options in PAM-CRASH, including their assumptions and limits.
- Calibration from coupon tests to full-vehicle correlation, including rate effects and mixed-mode criteria.
- Common numerical problems — contact instability after rupture, hourglassing, non-physical weld survival — and how to diagnose them.
- Case-based correlation studies and the interpretation of weld failure patterns in the context of occupant protection.
A first worked example: shear vs. peel in a front rail joint
Consider a simplified lap-shear coupon representing a front rail-to-apron connection: two 1.5 mm DP600 sheets, 6 mm nugget diameter, loaded at 10 mm/min in a tensile frame. A typical measured peak force is on the order of 8–12 kN, with failure occurring by nugget pull-out at 2–4 mm displacement. If the same joint is loaded in peel (e.g., a coach-peel specimen), the peak force drops to roughly 2–4 kN and the displacement at failure increases. In a crash simulation, the front rail joint experiences a mixed mode: initial shear during axial collapse, transitioning to peel as the rail bends. A model calibrated only on lap-shear data will predict survival where the real joint would pull out.
The practical fix is to define a failure criterion that depends on the loading angle, or to use a stress-based criterion with separate shear and normal components. In PAM-CRASH this is often implemented through a user-defined failure law or a combined force/moment criterion on the weld element. The calibration target is not a single number but a set of coupon curves: lap-shear, coach-peel, and if available, a mixed-mode specimen such as the KS-II or a modified Arcan fixture.
How to judge whether a weld model is good enough
A weld failure model is adequate when three conditions hold. First, the predicted failure sequence in the full-vehicle run matches the observed sequence in the physical test — not just the final count, but the order and location. Second, the global response (intrusion, acceleration pulse, energy absorption) is within the correlation target, typically ±10% on key intrusion measurements. Third, the model behaves stably: no spurious contact forces, no weld elements that survive beyond physically reasonable strain, and no energy balance anomalies. If any of these fail, the model needs recalibration or a different representation, not a numerical workaround.
This course treats weld failure as an engineering decision problem, not a software feature tour. The goal is that by the end, you can look at a crash result, identify whether a weld failure prediction is credible, and know what to change if it is not.