3. Material characterization for roof crush
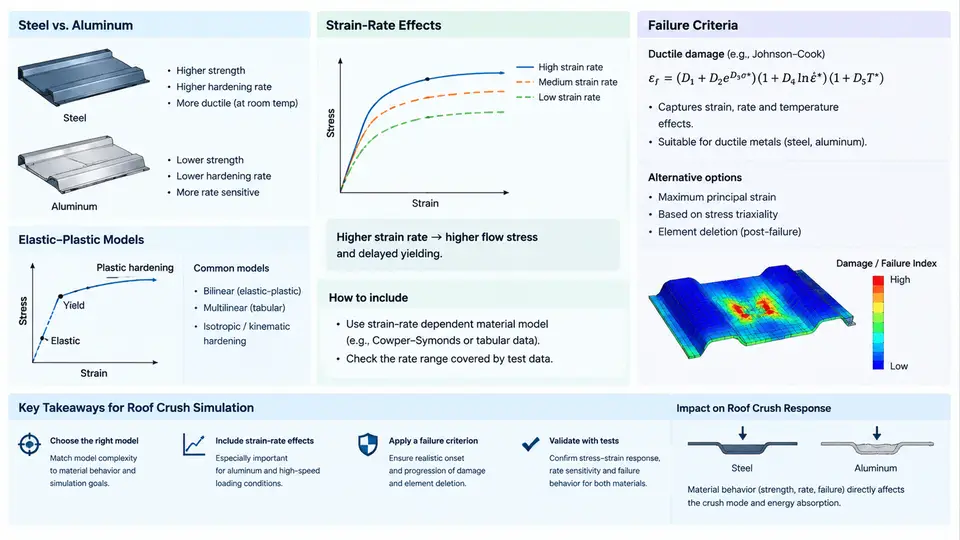
Roof crush simulation is only as trustworthy as the constitutive data behind it. In a FMVSS 216a or ECE R94-style loading scenario, the roof rail, B-pillar, and roof bow experience large plastic bending, local buckling, and, in many cases, fracture at spot welds or in the heat-affected zone. If the material card is calibrated only from a tensile test at quasi-static rates, the model will over-predict stiffness and under-predict the onset of tearing. This section covers how to build a defensible material dataset for the two dominant body-in-white (BIW) material families: mild and advanced high-strength steels (AHSS), and 5xxx/6xxx-series aluminum.
3.1 Elastic-Plastic Models: From Tensile Curve to PAM-CRASH Card
PAM-CRASH supports several plasticity formulations. For roof crush, the most common are MAT_36 (elastic-plastic with isotropic hardening, often used for steel), MAT_103 (anisotropic Barlat yield for aluminum sheet), and MAT_24 (piecewise linear plasticity) when a simple, well-validated curve is sufficient. The choice is driven by the material's anisotropy and the strain range of interest.
The starting point is a uniaxial tensile test per ASTM E8 (steel) or ASTM B557 (aluminum). From the engineering stress–strain curve, you must convert to true stress–true strain before entering the data:
ε_true = ln(1 + ε_eng)
σ_true = σ_eng * (1 + ε_eng)
For a typical DP590 steel, the quasi-static true stress at 10% plastic strain might be 780 MPa, with an ultimate true stress near 1050 MPa at 0.18 true strain. For AA6061-T6, the yield is around 275 MPa with much lower hardening capacity. These values are illustrative; always use your own certified test data.
Beyond the tensile curve, you need the elastic modulus (210 GPa for steel, 70 GPa for aluminum), Poisson's ratio (0.3 for steel, 0.33 for aluminum), and density (7.85e-9 tonne/mm³ for steel, 2.70e-9 tonne/mm³ for aluminum in PAM-CRASH's mm-tonne-s unit system). The plastic hardening curve should be entered as a table of true stress versus plastic strain, starting from the yield point and extending to the failure strain. Extrapolation beyond the last measured point is dangerous; if the simulation is expected to reach 25% strain, the test must cover that range, or a validated extrapolation law (e.g., Swift or Voce) must be used.
MAT_103 with the Barlat Yld2000 yield locus. This captures the anisotropic yield behavior that isotropic von Mises models miss, which matters for roof rails formed from rolled sheet.
3.2 Strain-Rate Effects: Why Roof Crush Is Not Quasi-Static
Roof crush loading rates are typically in the range of 0.1 to 1.0 m/s at the platen, but local strain rates in the hinge zones and spot-weld regions can reach 10–100 s⁻¹. Steels exhibit positive strain-rate sensitivity: yield and flow stress increase with strain rate. Aluminum alloys, particularly 6xxx series, show much weaker rate sensitivity and can even exhibit negative sensitivity at elevated temperatures.
To characterize this, perform split Hopkinson pressure bar (SHPB) tests at 100–1000 s⁻¹, or at minimum, intermediate-rate servo-hydraulic tests at 1–10 s⁻¹. The data is then fitted to a Cowper-Symonds model:
σ_dynamic / σ_static = 1 + (ε̇ / D)^(1/p)For DP590, typical fitted values are D = 8000 s⁻¹ and p = 4.5. For AA6061-T6, D = 6500 s⁻¹ and p = 4.0, but the rate effect is much smaller in magnitude. In PAM-CRASH, these are entered as D and P on the material card, or as a tabulated rate-dependent yield stress if using MAT_103.
A practical check: run a single-element simulation at the expected strain rate and compare the predicted flow stress to the test data. If the error exceeds 10%, revisit the fit. Do not assume that quasi-static data plus a generic Cowper-Symonds coefficient will suffice for a different heat treatment or supplier.
3.3 Failure Criteria: Predicting Tearing and Spot-Weld Failure
Roof crush simulations often fail to match physical tests because the failure model is too simple. The two dominant failure modes are:
- Ductile fracture in the base metal, typically at the B-pillar bend or roof rail hinge.
- Spot-weld pull-out or interfacial failure at the roof-to-rail and pillar-to-roof joints.
For ductile fracture, PAM-CRASH offers MAT_36 with a plastic strain-to-failure criterion, but this is mesh-sensitive. A more robust approach is to use a damage mechanics model such as MAT_104 (GISSMO) or MAT_123 (Johnson-Cook). GISSMO requires a failure strain versus triaxiality curve, which you obtain from notched tensile tests, shear tests, and plane-strain tests. For a typical DP590, the failure strain at zero triaxiality might be 0.45, dropping to 0.15 at a triaxiality of 0.6.
For spot welds, use MAT_100 (spot-weld beam) or a solid element representation with a cohesive zone. The weld nugget diameter and the failure load must be calibrated from cross-tension and lap-shear tests. A common mistake is to use the base metal failure strain for the weld; the weld is typically harder and less ductile, with failure strains of 0.05–0.10.
3.4 Practical Calibration Workflow
The following workflow is recommended for each material and joint type:
- Obtain certified tensile data at quasi-static and intermediate rates. Convert to true stress–true strain.
- Fit the hardening curve (Swift, Voce, or piecewise linear) and the rate sensitivity (Cowper-Symonds or tabulated).
- Calibrate the failure model using notched and shear coupon simulations. Adjust the failure strain versus triaxiality curve until the coupon force–displacement response matches the test.
- Validate on a sub-component, such as a B-pillar section under three-point bending, before committing to the full roof crush model.
- Document the material card, the test data source, and the calibration error. A typical acceptable error is within 10% on peak force and within 15% on energy absorption.
The table below summarizes typical parameter ranges for the two material families. These are illustrative starting points, not a substitute for project-specific testing.
| Parameter | DP590 Steel | AA6061-T6 |
|---|---|---|
| Elastic modulus (GPa) | 210 | 70 |
| Poisson's ratio | 0.30 | 0.33 |
| Density (tonne/mm³) | 7.85e-9 | 2.70e-9 |
| Yield stress (MPa) | 350–420 | 250–290 |
| Ultimate true stress (MPa) | 950–1100 | 310–350 |
| Failure strain (base metal) | 0.15–0.25 | 0.08–0.14 |
| Cowper-Symonds D (s⁻¹) | 6000–10000 | 5000–8000 |
| Cowper-Symonds p | 4.0–5.0 | 3.5–4.5 |
The SVG below illustrates the data flow from coupon tests to the final material card, highlighting the three calibration loops that must converge before the roof crush model is considered validated.
Once the material card is built, the final step is to document the calibration error on the sub-component. If the B-pillar bending simulation over-predicts peak force by more than 10%, the hardening curve is likely too stiff; if it under-predicts energy absorption, the failure strain is likely too high. Adjust the relevant parameter and re-run the coupon-level calibration before touching the full roof model. This disciplined loop is what separates a predictive roof crush simulation from a curve-fitting exercise.