3. Vehicle finite element model preparation
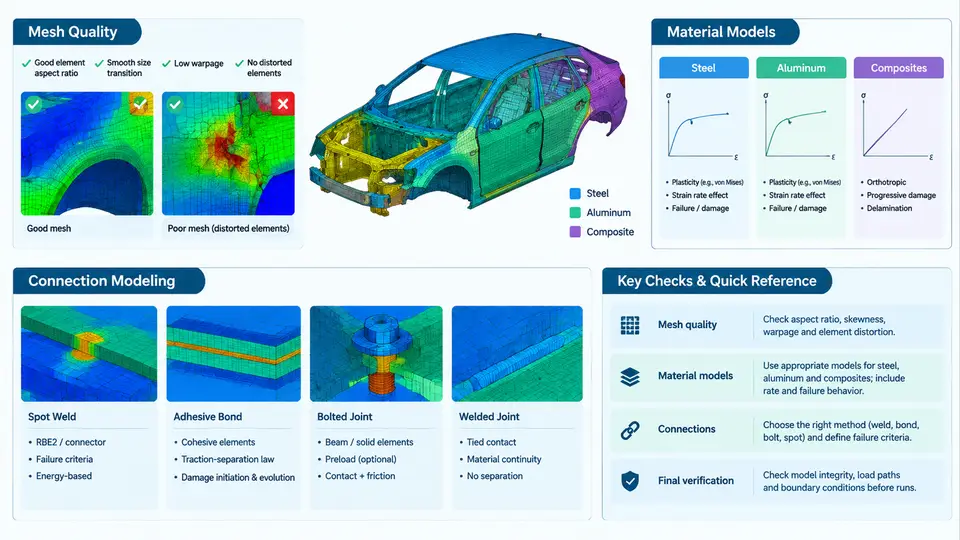
A multi-impact crash simulation is only as trustworthy as the finite element (FE) model it runs on. In PAM-CRASH, the solver will happily integrate a poorly meshed, incorrectly connected model and return numbers — but those numbers will be physically meaningless. This chapter covers the three pillars of model preparation that dominate the accuracy of any subsequent design optimization: mesh quality, material models for steel, aluminum, and composites, and connection modeling. Each pillar is treated with the specific requirements of multi-impact loading in mind, where the same structure must absorb energy in successive events without numerical artifacts accumulating.
Mesh Quality: The Foundation of Stable Explicit Integration
PAM-CRASH uses an explicit time integration scheme, which means the stable time step is governed by the smallest element in the model. A single degenerate shell element with a characteristic length of 0.5 mm can force the entire model to run at a fraction of its intended time step, multiplying wall-clock time without improving accuracy. More critically, poor element quality produces hourglassing, negative volumes, and spurious stress concentrations that corrupt the contact forces driving the crash response.
The practical workflow begins with a systematic quality audit before any material or connection work. The following thresholds are widely accepted for crashworthiness models and serve as a reasonable starting point:
| Quality Metric | Target | Acceptable Limit | Failure Symptom if Violated |
|---|---|---|---|
| Jacobian ratio | > 0.7 | > 0.5 | Negative volume, solver termination |
| Warpage angle (shell) | < 5° | < 15° | Inaccurate bending stiffness |
| Aspect ratio | < 3 | < 5 | Directional stiffness bias |
| Skew angle | < 30° | < 45° | Shear locking, hourglassing |
| Minimum element size | > 5 mm | > 3 mm | Time step collapse |
| Trias in quad regions | < 5% | < 10% | Overly stiff membrane response |
For multi-impact models, an additional consideration applies: elements in the primary crush zones must be sized to capture the folding wavelength of the sheet metal. As a rule of thumb, at least three to five elements should span the expected fold half-wavelength. For a typical 1.5 mm thick high-strength steel front rail, this translates to a target element size of 4–6 mm in the axial crush zone, transitioning to 8–10 mm in non-deforming regions. This graded mesh strategy keeps the critical time step manageable while preserving the local buckling behavior that determines energy absorption.
Material Models: Steel, Aluminum, and Composites
Material model selection in PAM-CRASH is a matter of matching the constitutive law to the dominant deformation mechanism and failure mode of each material class. The following subsections summarize the models most commonly used in multi-impact vehicle design.
Steel
For mild and high-strength steels, the Johnson-Cook (PAM-CRASH material type 106) or the simpler elastoplastic with isotropic hardening (type 101) are standard. The key inputs are density (7.85 × 10⁻⁹ t/mm³), Young's modulus (210 GPa), Poisson's ratio (0.3), and a true stress–plastic strain curve derived from coupon tests at the relevant strain rates. For multi-impact, strain-rate sensitivity must be included — the Cowper-Symonds coefficients (C and p) or a tabulated rate-dependent yield curve. A typical DP780 steel might use C = 40,000 s⁻¹ and p = 5, with the flow curve extrapolated to 0.5 plastic strain. Failure is handled either by a plastic strain limit or, more accurately, by a damage model such as GISSMO (Generalized Incremental Stress State dependent damage MOdel), which accounts for stress triaxiality and Lode angle — critical when the same material experiences bending in impact one and shear in impact two.
Aluminum
Aluminum alloys (e.g., 6061-T6, 7075-T6) exhibit lower ductility and different strain-rate sensitivity than steel. PAM-CRASH type 106 with appropriate parameters works, but the flow curve must be calibrated from tensile tests on the actual alloy and temper. Density is 2.70 × 10⁻⁹ t/mm³, Young's modulus 70 GPa. For extruded crash members, the anisotropy introduced by the extrusion process can be captured with an anisotropic yield surface (Hill or Barlat), though many production models accept isotropic approximation for initial design iterations. The failure strain for aluminum is typically 0.08–0.15, significantly lower than steel, so element deletion criteria must be set carefully to avoid premature loss of load path.
Composites
Carbon-fiber-reinforced polymer (CFRP) and glass-fiber-reinforced polymer (GFRP) require a different modeling philosophy. PAM-CRASH offers dedicated composite material models (e.g., type 131 for unidirectional plies, type 132 for woven fabrics) that track fiber and matrix damage separately. The inputs include ply thickness, fiber orientation, elastic moduli (E₁, E₂, G₁₂), strengths (X, Y, S), and fracture energies. For multi-impact, the critical issue is that composite damage is irreversible and often invisible — a delamination from impact one may not change the surface appearance but will reduce the residual strength for impact two. The model must therefore retain damage state variables between events, which PAM-CRASH does naturally when a restart is used. A common pitfall is using a single-layer shell representation for thick laminates; for multi-impact, at least three integration points through the thickness are recommended to capture bending–membrane coupling and delamination-driven failure.
Connection Modeling: Spot Welds, Adhesives, and Bolts
Connections are the most frequent source of non-physical behavior in crash models. A spot weld that is modeled as a rigid constraint will never fail, artificially tying together panels that should separate. Conversely, an over-stiff weld model can suppress the folding mechanism entirely.
For spot welds, the industry standard in PAM-CRASH is a tied contact with a failure criterion, or a dedicated spot-weld element (type 60) with a force-based or displacement-based rupture threshold. The weld nugget diameter (typically 5–7 mm for automotive steel) and the sheet thickness determine the failure load. A practical approach is to calibrate the weld failure criterion against a lap-shear or coach-peel test coupon. For multi-impact, welds in the primary crush zone should be allowed to fail progressively — a weld that survives impact one but is weakened should have a reduced residual strength for impact two, which can be implemented by degrading the failure threshold based on accumulated plastic strain.
Structural adhesives are increasingly common in mixed-material bodies. PAM-CRASH models adhesive layers with cohesive zone elements (type 303) or solid elements with a damage law. The cohesive parameters — peak traction, fracture energy in mode I and mode II — must be measured via double-cantilever beam (DCB) and end-notched flexure (ENF) tests. For multi-impact, the adhesive's viscoelastic recovery between events means that some stiffness returns after unloading; a simple damage model that does not account for this will over-predict damage accumulation.
Bolted joints are typically modeled with beam elements connecting the two sheets, with the beam diameter matched to the bolt shank and the end nodes tied to the surrounding shell mesh. The bolt preload can be represented by an initial stress in the beam, though for crash loading the preload effect is often secondary to the shear and tension failure of the bolt itself.
Bringing It Together: A Model Preparation Checklist
The following checklist is intended for direct use during model setup. It consolidates the key actions from the three pillars above and adds the multi-impact-specific steps that are often overlooked.
| Step | Action | Verification |
|---|---|---|
| 1 | Run mesh quality audit; export worst elements | All metrics within acceptable limits |
| 2 | Assign material models with rate-dependent flow curves | Coupon test correlation within 10% |
| 3 | Define spot weld failure criteria from lap-shear data | Weld failure load matches test |
| 4 | Set up cohesive properties for adhesives | DCB/ENF correlation |
| 5 | Enable restart with damage state retention | Restart file contains damage variables |
| 6 | Run a single-impact baseline and check energy balance | Hourglass energy < 5% of internal energy |
| 7 | Run two sequential impacts with restart | No negative volumes; stable time step |
With a properly prepared model — graded mesh, calibrated material models, and connections that fail realistically — the multi-impact simulation becomes a reliable predictor of structural performance. The next chapter builds on this foundation by introducing the loading and boundary conditions specific to multi-impact scenarios.