1. Course overview
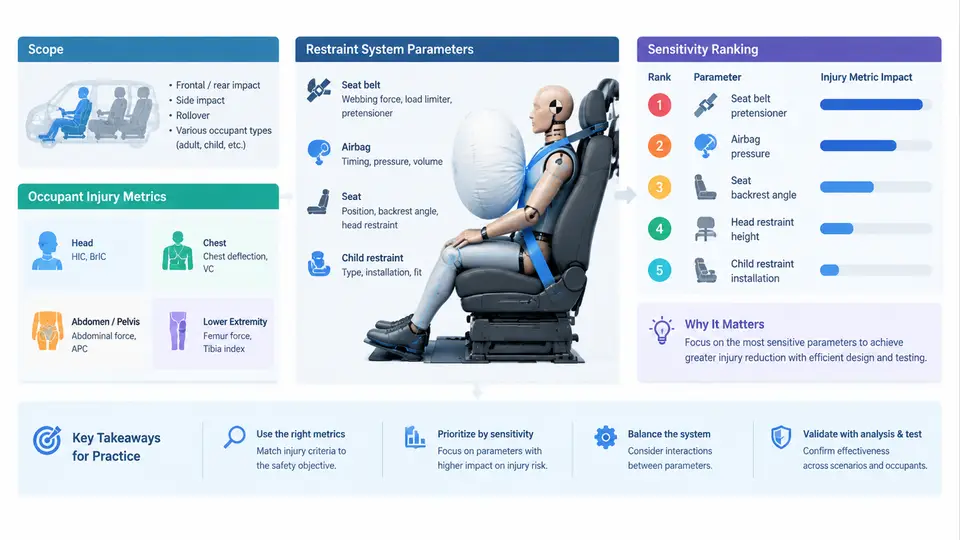
Occupant safety engineering is fundamentally a problem of allocating limited design freedom under conflicting constraints. A vehicle body must absorb crash energy without intruding into the occupant compartment; an airbag must inflate fast enough to cushion the head yet not so aggressively that it causes neck injury; a seat belt must couple the occupant to the decelerating vehicle while allowing controlled ride-down. Every one of these decisions is governed by a set of tunable restraint system parameters, and every outcome is measured against a set of occupant injury metrics. The central question this course addresses is deceptively simple: which parameters matter most, and by how much? Sensitivity ranking is the discipline that answers this question quantitatively, and it is the thread that runs through all thirty chapters of this course.
Scope of the Course
This course covers the full analytical chain from restraint parameter definition to ranked influence on injury outcomes. It is organized around four connected themes. First, we establish the vocabulary: what injury metrics are used, how they are computed from physical measurements, and what regulatory and consumer-test thresholds apply. Second, we define the restraint parameter space — the geometric, material, and control variables that engineers can actually change. Third, we build the experimental and numerical machinery needed to map parameters to outcomes: Design of Experiments (DOE), finite element occupant simulations, sled testing, and the statistical treatment of results. Fourth, we interpret sensitivity results and convert them into design decisions, including robustness under occupant variation and manufacturing tolerance.
The scope deliberately spans both frontal and side impact, because the dominant parameters differ sharply between loading directions. It also spans the full occupant population, from the 5th-percentile female to the 95th-percentile male, and includes the child occupant and out-of-position (OOP) cases that frequently dominate real-world injury risk. What the course does not attempt is detailed restraint hardware design or full vehicle crashworthiness structural analysis; those are treated only insofar as they define boundary conditions for the occupant-level problem.
Occupant Injury Metrics
Injury metrics translate physical measurements — acceleration, force, deflection, pressure — into numbers that correlate with real injury risk. They fall into three families.
Head and brain metrics. The Head Injury Criterion (HIC) remains the most widely used scalar, computed from the resultant translational acceleration at the head center of gravity over a chosen time window:
HIC = max over (t1, t2) of [ (t2 - t1) * ( (1/(t2-t1)) * ∫ a(t) dt )^2.5 ]

Common windows: HIC15 (t2 - t1 ≤ 15 ms), HIC36 (≤ 36 ms)
Typical frontal regulatory limit: HIC36 ≤ 1000 (FMVSS 208)
Typical consumer-test target: HIC15 ≤ 700 (Euro NCAP, frontal)
HIC captures the severity of a single acceleration pulse but is insensitive to rotational loading, which is why modern assessments add rotational criteria such as BrIC (Brain Injury Criterion) and, in some protocols, head angular velocity limits. For side impact, HIC is supplemented by head excursion and contact-force checks.
Neck and spine metrics. Neck injury is characterized by the Neck Injury Criterion (NIC), which combines axial force and bending moment, and by Nij, a normalized interaction criterion that compares combined axial load and moment to injury-reference values. These matter most in rear impact and in airbag-deployment interactions.
Thorax and abdomen metrics. Chest deflection (in millimeters), the Viscous Criterion (VC, combining deflection and deflection rate), and the 3 ms acceleration limit are the standard thoracic measures. Abdominal pressure and penetration criteria apply in belt-loading and side-impact cases. For the lower extremities, femur axial force and tibia index capture the dominant fracture mechanisms.
Each metric has a defined measurement location, filtering standard (typically SAE J211 Channel Frequency Class), and threshold. A sensitivity study is only meaningful if the metric definition, filter class, and evaluation window are fixed before the study begins — otherwise the ranking reflects analysis choices rather than physics.
Restraint System Parameters
The restraint parameter space is large but structured. The principal groups are:
- Seat belt geometry and behavior: D-ring position, anchor locations, belt width, webbing stiffness, pretensioner stroke and timing, force limiter (load limiter) level and profile, and buckle position.
- Airbag parameters: inflator output (mass flow and gas temperature), vent size, bag volume and shape, fold pattern, tether configuration, deployment timing, and — for side airbags — coverage height and pressure.
- Seat and interior: seat cushion stiffness and geometry, seat back angle, head restraint position, knee bolster stiffness, and steering column collapse characteristics.
- Occupant and boundary conditions: occupant size and mass, seating position, posture, belt routing, and impact pulse severity and shape.
These parameters are not independent. A stiffer force limiter and a larger airbag vent both reduce chest loading but shift load to the head and neck; a pretensioner that fires earlier improves coupling but can increase chest compression in small occupants. Sensitivity ranking exists precisely because these interactions make intuition unreliable.
The Role of Sensitivity Ranking
Sensitivity ranking quantifies how much each parameter contributes to variation in each injury metric. It answers three practical questions: which parameters should receive design attention, which can be fixed at nominal values without loss, and where do interactions dominate. The output is typically a ranked list or tornado chart per metric, derived from DOE main effects, regression coefficients, variance-based Sobol indices, or local finite-difference gradients.
The figure below shows the conceptual data flow of a sensitivity study, from parameter definition through simulation or test execution to ranked influence on injury metrics.
The workflow is iterative rather than linear. An initial screening study with a coarse parameter set identifies the few factors that dominate; those factors are then refined with a higher-resolution DOE, and the ranking is re-evaluated. This two-stage approach is standard practice because a full factorial over twenty parameters at three levels would require over three billion runs — computationally impossible and experimentally absurd. Screening reduces the problem to a tractable subset before expensive refinement begins.
Why Ranking Changes Design Practice
Without sensitivity ranking, restraint tuning proceeds by trial and error against a nominal crash pulse with a nominal occupant. That approach systematically over-invests in parameters that happen to be convenient to change and under-invests in parameters that dominate variance across the real occupant population. A ranking study typically reveals that a small number of parameters — often three to five — account for the majority of metric variance, and that some intuitively important parameters (for example, airbag vent size within a plausible range) have surprisingly weak main effects once belt force limiting is active.
What You Will Be Able to Do
By the end of this course, you will be able to define a restraint parameter set with justified ranges, select an appropriate DOE for the number of factors and the available run budget, execute occupant simulations or sled tests with consistent metric extraction, compute and interpret sensitivity indices, and translate a ranked result into a defensible design recommendation that accounts for occupant variation and tolerance. You will also be able to recognize when a ranking is unreliable — for example, when the parameter ranges are too narrow to reveal nonlinearity, when interactions are strong but the DOE cannot resolve them, or when the metric definition was changed mid-study.
The chapters that follow build these capabilities in sequence, beginning with the injury metrics in detail and ending with robustness assessment and design integration. The single idea to carry forward from this overview is that sensitivity ranking is not a post-processing step appended to a crash simulation; it is the analytical framework that determines which simulations are worth running in the first place.