4. Pulse characterization
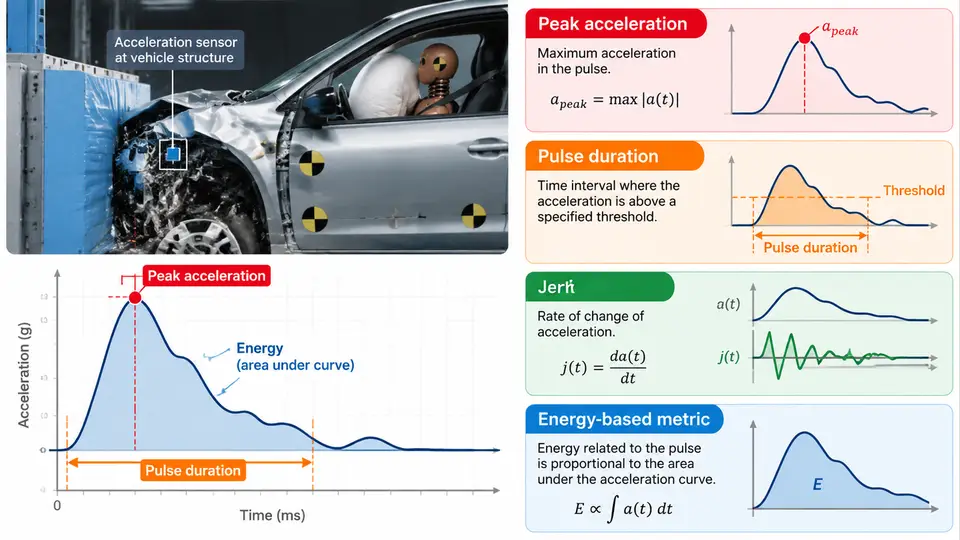
A frontal crash pulse is the acceleration–time history measured at a vehicle body reference point (typically the tunnel or rocker at the B-pillar base) during a barrier impact. Restraint system calibration is only as good as the pulse it is tuned against, so the first engineering task in any calibration program is to reduce that raw signal into a small set of scalar descriptors that can be compared, specified, and reproduced. This chapter covers the four descriptor families that matter most: peak acceleration, pulse duration, jerk, and energy-based metrics — and shows how each one is computed and used as a calibration target.
Sign Convention and Preprocessing
Before any metric is computed, fix the sign convention and document it. In this course, the vehicle travels in the +X direction and the crash deceleration is reported as a positive magnitude (a common convention in sled and barrier data reduction). If your data acquisition system stores deceleration as negative acceleration, invert the sign once at import and never mix conventions between the pulse file and the occupant simulation. A pulse that is sign-flipped relative to the model will produce a plausible-looking but completely wrong restraint timing.
Preprocessing steps that must precede characterization:
- Channel filtering: apply a low-pass filter consistent with the measurement standard in use (for example, a 4th-order Butterworth at 100–165 Hz for vehicle body channels, or the CFC 60 / CFC 180 classes defined in SAE J211). Record the filter class in the pulse metadata.
- Zero and offset correction: remove pre-trigger bias so the pulse starts at zero.
- Time-zero definition: define t = 0 at the trigger event (barrier contact or sled firing), not at the first sample above a threshold.
Peak Acceleration
Peak acceleration apeak is the maximum filtered deceleration magnitude within the pulse window. It is the single most quoted number in a crash pulse specification, but it is also the most easily misused. Two practical cautions apply:
- Peak is filter-sensitive. A 100 Hz and a 165 Hz filter on the same raw channel can differ by several g at the peak. Always state the filter class alongside the peak value.
- Peak location matters. The time at which the peak occurs, tpeak, tells you whether the pulse is front-loaded (stiff structure, early peak) or rear-loaded (soft crush, late peak). Restraint timing — airbag deployment thresholds, pretensioner firing, load-limiter force — is scheduled relative to this shape, not just the magnitude.
For calibration targets, peak acceleration is usually specified as a band, for example 35–42 g at the tunnel for a 50 km/h frontal rigid barrier test. A pulse outside the band is not automatically a failure, but it must be explained: a low peak with a long duration may indicate a soft front structure, while a high peak with a short duration may indicate a stiff or prematurely bottomed-out crush zone.
Pulse Duration
Duration is ambiguous unless defined. Three definitions are common and must be distinguished:
| Definition | Computation | Typical use |
|---|---|---|
| Total event duration | Time from t = 0 to the last sample above a small threshold (e.g., 2 g) | Event timing, data window length |
| Effective duration | Time interval containing the central portion of the pulse energy (see energy metrics) | Pulse shape comparison, sled replication |
| Half-sine equivalent duration | Duration of an equivalent half-sine with the same peak and velocity change | Analytical approximations, early concept work |
For calibration work, the effective duration is the most useful because it is tied to the velocity change the pulse delivers. A pulse that reaches 40 g but lasts only 40 ms delivers far less Δv than one that holds 40 g for 80 ms, and the restraint system sees very different occupant kinematics in the two cases.
Jerk
Jerk is the time derivative of acceleration, j = da/dt, and it captures how abruptly the pulse rises and falls. High jerk at the pulse onset produces high-frequency excitation of the occupant and the restraint hardware; it is associated with deployment-timing sensitivity, belt spool-out spikes, and noise in occupant response data. Jerk is computed by differentiating the filtered acceleration channel — differentiating raw data amplifies noise, so always differentiate the filtered signal and consider a second smoothing pass.
In practice, jerk is reported as a peak value (in g/ms) and as the rise time from 10% to 90% of peak acceleration. A short rise time (high jerk) means the restraint must be ready earlier; a long rise time gives the sensing system more time but may indicate a soft crush that will not decelerate the occupant enough before the barrier stops the vehicle.
Energy-Based Metrics
Energy metrics convert the pulse into quantities that relate directly to what the occupant experiences. The two most useful are:
- Velocity change Δv: the integral of acceleration over the pulse, Δv = ∫a dt. For a 50 km/h barrier test, Δv should approach the impact speed (13.9 m/s) minus any rebound; a large shortfall indicates a data window or integration error.
- Energy spectral density (ESD) and the energy-centroid time: the ESD shows how pulse energy is distributed in frequency, and the centroid time tc = ∫t·a²dt / ∫a²dt locates the "center of gravity" of the pulse in time. A front-loaded pulse has a small tc; a rear-loaded pulse has a large one. This single number is an excellent calibration target because it captures shape, not just magnitude.
A practical calibration target set therefore looks like: peak 38 ± 3 g, effective duration 75–90 ms, Δv ≥ 13.0 m/s, peak jerk ≤ 1.8 g/ms, and energy-centroid time 30–38 ms. These are illustrative values for a mid-size passenger car at 50 km/h; they must be replaced with program-specific targets derived from the vehicle's own development pulses.
Worked Example: Reducing a Pulse to Targets
Suppose the filtered tunnel channel from a 50 km/h rigid barrier test is sampled at 10 kHz over 0–150 ms. The reduction proceeds as follows:
- Confirm the sign convention and that t = 0 is at barrier contact.
- Apply the CFC 60 filter and record it in the metadata.
- Find apeak and tpeak; note whether the peak is a single spike or a plateau.
- Integrate to obtain Δv and check it against the impact speed.
- Compute the 10–90% rise time and the peak jerk from the filtered derivative.
- Compute the energy-centroid time and the effective duration from the cumulative energy curve.
- Compare the resulting descriptor set against the program target band and flag any descriptor outside it.
If Δv comes out well below the impact speed, the usual causes are a truncated data window, a filter that removed too much low-frequency content, or an uncorrected offset. If the peak jerk is implausibly high, check whether the derivative was taken on the raw rather than the filtered channel. These failure symptoms are diagnostic: they point to the processing step, not to the vehicle.
Using the Descriptor Set as a Calibration Contract
The value of reducing a pulse to five or six numbers is that those numbers become a contract between the vehicle program and the restraint team. The sled lab can reproduce a pulse that matches the descriptor set even if the detailed shape differs slightly, and the occupant simulation can be validated against the same set. When a calibration is later found to be marginal in a vehicle test, the descriptor set tells you immediately which dimension drifted: a peak that moved up by 4 g points to a stiffer front structure, while an energy-centroid time that moved later by 8 ms points to a change in crush progression — and each of those has a different implication for airbag and pretensioner timing.
Keep the descriptor set small, documented, and versioned alongside the pulse file. A pulse without its filter class, sign convention, and time-zero definition is not a calibration target; it is just a curve.