1. Frontal crash pulse fundamentals
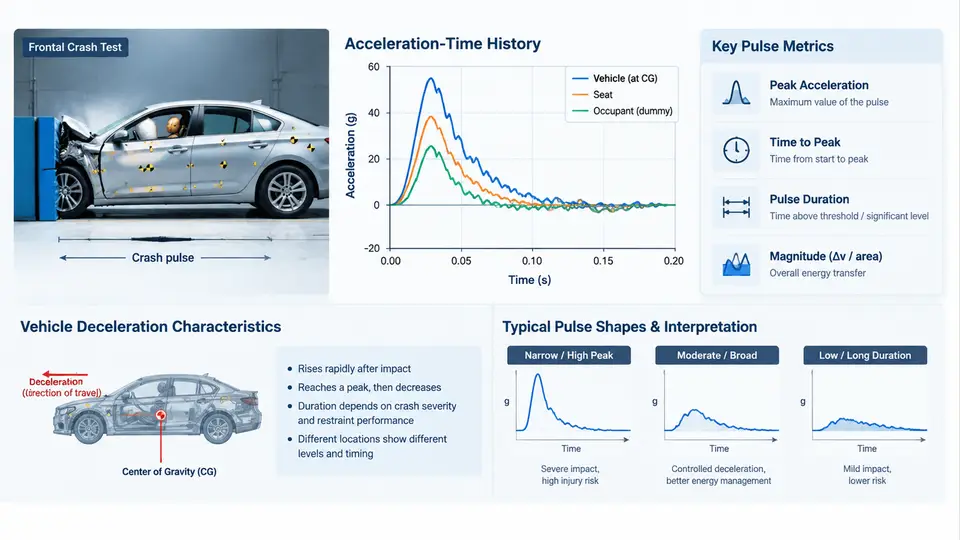
Every restraint system calibration decision ultimately traces back to a single signal: the vehicle body deceleration measured during a frontal impact. This acceleration–time history — the crash pulse — is the physical input that the occupant restraint controller (airbag ECU) sees, and it is the boundary condition against which airbag timing, seatbelt load limiting, and pretensioner firing are tuned. Before discussing thresholds, crash severity algorithms, or occupant kinematics, we must be precise about what the pulse is, how it is measured, which metrics describe it, and how vehicle structure shapes it.
Sign Convention and Measurement Chain
Establish the sign convention first, because every downstream calculation depends on it. In this course, the positive axis points in the direction of vehicle travel (forward). During a frontal barrier impact the vehicle decelerates, so the longitudinal acceleration ax(t) is negative in the travel direction. Many OEM datasets and ECU calibrations instead store the pulse as a positive "deceleration" magnitude; when you compare data from different sources, verify the sign convention before plotting or integrating. A sign error of this kind silently inverts velocity and displacement results.
The measurement chain is short but each element matters. A uniaxial or triaxial accelerometer is rigidly mounted to the vehicle body — typically on the tunnel, the seat cross-member, or a structural node near the B-pillar base — with its sensitive axis aligned to the vehicle longitudinal axis. The analog signal passes through an anti-alias filter, is sampled (commonly at 10–20 kHz for raw crash data, then resampled to 1–10 kHz for pulse analysis), and is filtered according to the channel frequency class (CFC) defined in SAE J211/1. For crash pulse work, CFC 60 (approximately 100 Hz cutoff) is the standard class: it removes structural ringing that is irrelevant to occupant response while preserving the pulse shape that matters. Always state the CFC when you report a pulse; a CFC 180 and a CFC 60 version of the same event look meaningfully different.
Reading the Acceleration–Time History
A typical frontal pulse has three recognizable phases. The initial rise occurs as the bumper, crush cans, and front rails begin to deform; acceleration ramps from zero to its first significant level within roughly 10–30 ms. The main crush phase follows, where the longitudinal rails, shotgun, and lower structure absorb energy through progressive folding; this is where the pulse reaches its peak and where most of the velocity change is accumulated. Finally, the rebound and settling phase appears as the vehicle separates from the barrier and residual structural oscillation decays. The pulse is not a smooth curve — it carries high-frequency content from rail folding and engine/transmission interaction, which is exactly why filtering and metric selection matter.
From the acceleration history, two derived quantities are computed by integration:
- Velocity change: Δv(t) = ∫ ax(t) dt. The total Δv at the end of the event is the delta-v of the crash, a primary severity indicator.
- Displacement: s(t) = ∫∫ ax(t) dt², which approximates the dynamic crush of the vehicle front end.
In practice these integrations are performed numerically on the filtered signal, with baseline correction (removing any DC offset) applied first. An uncorrected offset of even 0.5 g integrated over 100 ms produces a velocity error of about 0.5 m/s — enough to shift a severity classification.
Pulse Metrics That Drive Calibration
Engineers rarely calibrate against the raw curve. Instead, a small set of scalar metrics summarizes the pulse and feeds requirement documents and ECU algorithm tuning:
| Metric | Definition | Typical frontal range (example) | Calibration relevance |
|---|---|---|---|
| Peak deceleration | Maximum |ax| after CFC 60 filtering | 35–55 g | Sets sensor saturation margin and structural load targets |
| Delta-v | Integrated velocity change over the event | 40–65 km/h equivalent | Primary severity input; correlates with occupant injury risk |
| Pulse duration | Time from 10% rise to return near zero | 80–130 ms | Determines airbag deployment window and venting time |
| Time to peak | Interval from impact (t=0) to peak deceleration | 25–50 ms | Drives must-fire timing and pretensioner trigger point |
| Crush displacement | Double integral of ax | 500–800 mm | Cross-check against structural crush measurements |
The values above are illustrative engineering ranges for a mid-size passenger car in a 50–64 km/h frontal barrier or offset test; they are not measured results and must be replaced with program-specific data. The point is the relationship: a stiffer front structure raises peak deceleration and shortens duration for the same delta-v, while a softer, longer-stroke structure lowers the peak and stretches the pulse. Restraint calibration must follow that trade-off.
Vehicle Deceleration Characteristics and Structure Interaction
The pulse shape is a direct fingerprint of how the front structure manages energy. Three qualitative families are useful to recognize:
- Stiff / short-stroke pulses: high peak, short duration, steep rise. Common in vehicles with rigid bumper beams and limited crush space. Occupants experience high early acceleration; airbag must fire early and belt load limiters must be tuned to avoid excessive chest loading.
- Soft / long-stroke pulses: lower peak, longer duration, gentler rise. More crush distance absorbs energy over time. Airbag timing can be slightly later, but the longer pulse means the occupant may move further forward before the restraint engages.
- Two-stage pulses: an initial structural peak followed by a secondary rise from engine/transmission contact or a second energy-absorbing stage. These complicate crash severity algorithms because a simple peak threshold may trigger too early or too late.
This is why the same airbag ECU calibration cannot be carried over between vehicle platforms without re-validation: the pulse is platform-specific, and the ECU's crash severity algorithm is tuned to recognize the timing and amplitude signature of that platform's structural response.
Worked Example: From Raw Signal to Calibration Inputs
Consider an illustrative dataset from a 56 km/h full frontal rigid barrier test of a mid-size sedan (example values, not measured): the CFC 60 pulse rises from 0 g at t = 0 to a first peak of 42 g at t = 32 ms, holds between 30 and 40 g until about 70 ms, then decays to near zero by 110 ms. Integrating the filtered signal yields a total delta-v of approximately 15.5 m/s (about 56 km/h), consistent with the barrier speed — a good sanity check. The double integral gives a dynamic crush of roughly 650 mm, which should be cross-checked against the physical post-test crush measurement of the front structure.
From this pulse, the calibration team extracts: must-fire time window (typically derived from time-to-peak minus a margin), the severity thresholds for single-stage versus dual-stage deployment, and the pretensioner trigger point. Each of these is a direct function of the metrics above, which is why the pulse must be characterized rigorously before any restraint tuning begins.
Why This Matters for Restraint Calibration
The crash pulse is not background context — it is the input signal to every restraint decision. The airbag ECU's crash severity algorithm compares filtered acceleration against calibrated thresholds and time windows; if the pulse rises faster than the calibration expects, the algorithm may classify a moderate event as severe and fire both stages unnecessarily. If the pulse is softer and later than expected, deployment may occur after the occupant has already moved into the airbag's path. Belt pretensioners and load limiters are likewise tuned to the timing and magnitude of occupant forward excursion, which is a direct consequence of the pulse. In later chapters, we will use these metrics to build severity thresholds, but the foundation is here: a correctly measured, correctly filtered, correctly integrated acceleration–time history, summarized by metrics that the calibration team can defend.