1. Crash test data acquisition systems
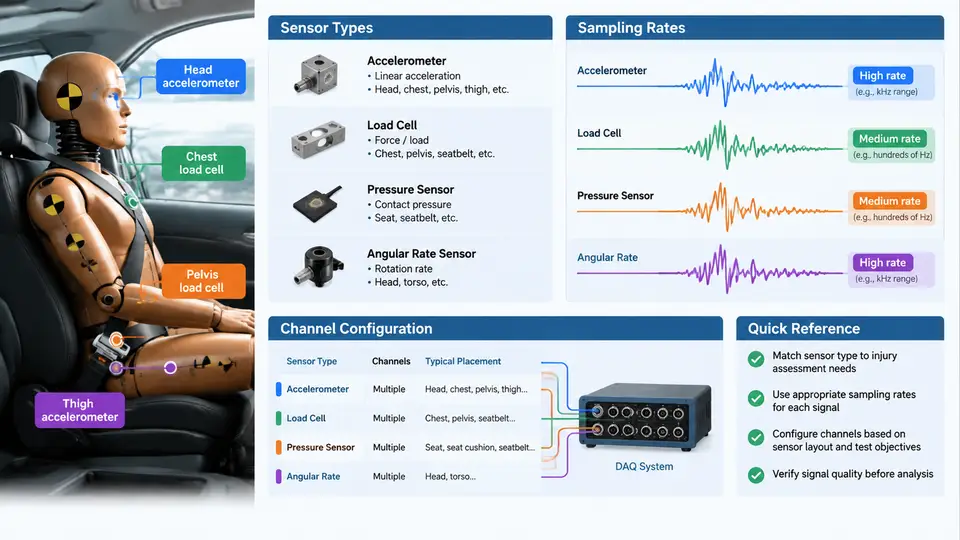
Every occupant injury assessment begins with a measurement chain. Before any HIC value, chest deflection percentage, or femur load can be computed, the data acquisition system (DAS) must faithfully capture the physical response of the dummy, vehicle structure, and restraint system during a crash event lasting 100–150 ms. A single misconfigured channel — a wrong filter class, an aliased sampling rate, or an incorrectly zeroed bridge — can invalidate an entire test. This chapter establishes the measurement foundation: which sensors are used, how fast they must be sampled, and how channels are configured and verified before the sled or barrier is released.
Sensor Families Used in Occupant Injury Assessment
Crash test instrumentation falls into four functional groups, each with distinct electrical characteristics and signal conditioning requirements.
- Accelerometers — Piezoresistive (MEMS) or piezoelectric units mounted on the vehicle structure (B-pillar, sill, tunnel), on the dummy (head, chest, pelvis), and on the sled. Ranges are typically ±500 g to ±2000 g for structural channels and ±250 g to ±500 g for dummy head and chest channels. Output is analog voltage or a digital sensor bus signal.
- Load cells and force transducers — Strain-gauge bridges in the dummy femur, tibia, neck, and lumbar spine, and in barrier load cells. Bridge excitation is typically 5–10 V DC; full-scale output is 1–3 mV/V, requiring high-gain, low-noise amplification.
- Potentiometers and string pots — Measure chest deflection (chest band potentiometer), steering column displacement, and pedal travel. Resistive output is ratiometric to excitation voltage.
- Angular rate sensors and tilt sensors — Gyroscopes on the dummy head and pelvis for rotational kinematics, increasingly important for brain injury criteria such as BrIC.
Modern dummies such as the Hybrid III and THOR also carry internal DAS modules (in-dummy data acquisition), which digitize signals at the sensor and transmit over a CAN or Ethernet backbone. This shortens analog cable runs and reduces noise pickup, but introduces channel-count and bus-bandwidth constraints that must be planned before the test.
Sampling Rate: The Nyquist Constraint in Practice
Crash pulses contain significant energy up to roughly 1 kHz for structural channels and up to 1.5–2 kHz for stiff contact events such as head-to-pillar impacts. The sampling theorem requires a rate above twice the highest frequency of interest, but practical crash data acquisition uses substantial oversampling to preserve pulse shape and to support digital filtering.
SAE J211/1 and ISO 6487 define the channel filter classes (CFC 60, CFC 180, CFC 600, CFC 1000) and specify minimum sampling rates. The widely applied rule is a sampling rate of at least ten times the channel filter cut-off frequency:
| Channel type | Filter class | Cut-off (−3 dB) | Minimum sample rate | Typical configured rate |
|---|---|---|---|---|
| Vehicle structure acceleration | CFC 60 | 100 Hz | 1 000 Hz | 10 000 Hz |
| Dummy head / chest acceleration | CFC 180 | 300 Hz | 3 000 Hz | 10 000–20 000 Hz |
| Seat belt force, femur load | CFC 600 | 1 000 Hz | 10 000 Hz | 20 000 Hz |
| Contact force, stiff impact | CFC 1000 | 1 650 Hz | 16 500 Hz | 20 000–50 000 Hz |
Note that the anti-alias filter in the DAS front end must be set below half the sample rate, independent of the post-test CFC filter applied in analysis. If a channel is sampled at 10 kHz, the hardware anti-alias cut-off should sit near 4 kHz; the CFC 180 filter is then applied digitally afterwards. Confusing the two filter stages is one of the most common configuration errors.
Channel Configuration and the Measurement Chain
Each channel is defined by a complete chain: sensor → cable → amplifier/filter → digitizer → recorded channel. Configuration means assigning and verifying every element of that chain. A practical pre-test workflow for a frontal sled test with 48 channels proceeds as follows.
- Channel map and scaling. Assign each sensor a channel number, record its serial number, sensitivity (e.g., 0.512 mV/g), and full-scale range. Enter the sensitivity into the DAS so that raw counts convert to engineering units. A 16-bit digitizer over ±5 V gives 152.6 µV/count; with 0.512 mV/g sensitivity, one count equals roughly 0.0033 g — adequate resolution for a ±250 g head channel.
- Bridge balance and shunt calibration. For strain-gauge load cells, zero the bridge with the dummy unloaded, then apply a known shunt resistor across one arm to simulate a defined load. Record the resulting output and compare it with the expected value; a deviation beyond ±2 % indicates a wiring or gauge fault.
- Filter and rate assignment. Set the hardware anti-alias filter and sample rate per the table above, and tag each channel with its analysis CFC class so post-processing applies the correct digital filter.
- Pre-test verification. Perform a tap test or apply a known static load to confirm the full chain responds. Check for open channels (flat line), excessive offset, and 50/60 Hz mains hum on the noise floor.
Signal Chain and Trigger Architecture
The diagram below shows how the measurement chain is organized from sensor to recorded channel, including the two filter stages and the common trigger point that time-aligns all channels.
Time Zero, Triggering, and Channel Alignment
All channels must share a common time zero, defined by the trigger event — typically the first contact of the barrier or the sled pulse onset. The DAS should be configured in pre-trigger mode, continuously buffering data so that several hundred milliseconds before impact are retained. After the test, verify alignment by checking that the sled accelerometer and the vehicle sill accelerometer show the same pulse onset within one or two samples. A channel that appears shifted by tens of milliseconds usually indicates a separate trigger source or a buffering error, and any injury value computed from it will be temporally misattributed.
Verification Before Release
A disciplined pre-test check catches most failures before the irreversible event. Confirm that every channel shows a live, low-noise signal; that shunt calibration results are within tolerance; that the sample rate and CFC tag match the test plan; and that the pre-trigger buffer is armed. Record the channel map and calibration values in the test log so that post-test analysis can trace every engineering-unit conversion back to a documented sensitivity. With the measurement chain verified, the data recorded during the crash can be trusted as the basis for occupant injury assessment.