1. Course overview
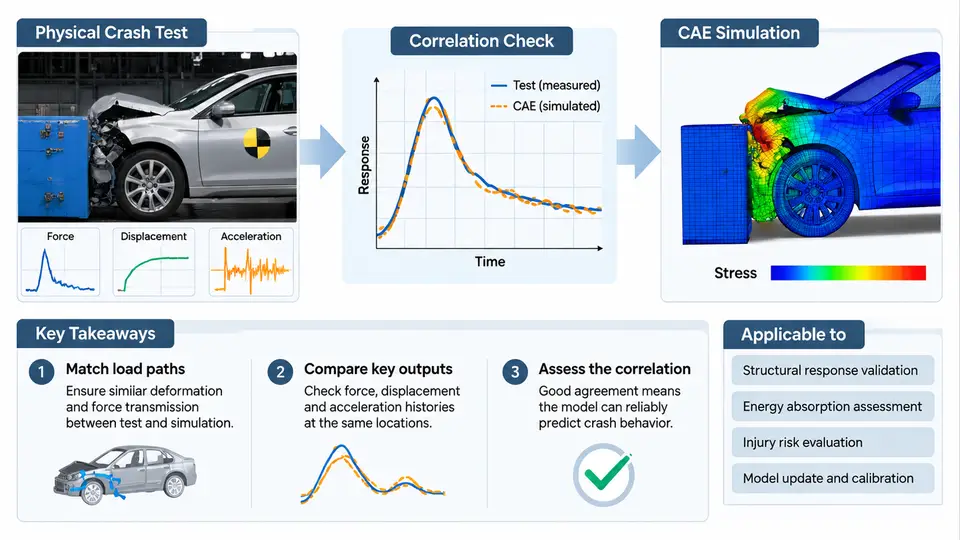
Automotive crashworthiness development rests on two complementary pillars: physical crash testing, in which real vehicles or sleds are accelerated into barriers and the resulting deformation and occupant loading are measured; and CAE (Computer-Aided Engineering) simulation, in which explicit finite element solvers such as LS-DYNA, PAM-CRASH, or Radioss reproduce the same event numerically. Neither pillar is sufficient alone. A test is expensive, destructive, and available only at discrete build stages; a simulation is cheap to iterate but only as trustworthy as its validation. CAE correlation is the disciplined engineering activity that quantifies how well the model reproduces the test, explains the residual differences, and decides whether the model is fit for its intended predictive use.
This course treats correlation not as a cosmetic "model tuning" exercise but as a measurable, auditable process. By the end, you should be able to plan a test–CAE campaign, define the metrics that judge agreement, diagnose the physical causes of mismatch, and document a defensible correlation conclusion.
What "Correlation" Actually Means
Correlation is the quantitative and qualitative comparison between a physical test result and the corresponding CAE prediction for the same event, boundary conditions, and measurement locations. It is distinct from validation (does the model represent the real physics for its intended purpose?) and from verification (is the model solved and implemented correctly?). A useful working definition for this course:
The "same event" clause is the most frequently violated. If the test vehicle carried 68 kg of ballast that the model omitted, or the barrier face friction differed, the comparison is meaningless regardless of how sophisticated the metrics are.
The Physical Test Landscape
Physical crash testing spans several event families, each with its own regulatory or consumer-programme driver:
| Event family | Typical configuration | Primary measurement focus |
|---|---|---|
| Full frontal rigid barrier | 56 km/h, 100% overlap, rigid wall | Occupant restraint loading, structural crush |
| Offset deformable barrier (ODB) | 64 km/h, 40% overlap, honeycomb face | Asymmetric intrusion, footwell integrity |
| Side impact (MDB) | 50–60 km/h moving deformable barrier | Door intrusion velocity, thorax loading |
| Pole / narrow object | 32 km/h, rigid pole | Localized intrusion, head path |
| Sled test | Prescribed pulse, no vehicle structure | Restraint system performance only |
Instrumentation typically includes accelerometers on the vehicle body and on the occupant (or Hybrid III / THOR ATD), load cells in the barrier, string potentiometers or optical systems for intrusion, and high-speed video at 500–1000 fps. The raw signals are filtered per SAE J211 (Channel Frequency Class 60 for vehicle structure, CFC 180 or 600 for occupant head/chest), and this filtering must be applied identically to the CAE output before any comparison.
The CAE Side of the Equation
A production crash model contains 5–15 million elements, explicit time integration with a stable time step typically in the 0.5–1.5 µs range, and material models ranging from simple elastic–plastic steel (MAT_024) to strain-rate-sensitive and failure-enabled formulations (MAT_123, MAT_224). Spot welds, adhesive joints, bolts, and seams are represented by constrained or tied contact definitions. The model's fidelity depends on mesh size in crush zones (often 5–8 mm), the accuracy of the material card, and the correct representation of joining and contact.
Correlation therefore has three error sources to separate: test variability (build tolerance, barrier alignment, sensor drift), modeling idealization (mesh, material, joints), and numerical error (hourglassing, contact penetration, time-step artifacts). A mature correlation engineer learns to attribute residuals to the correct source rather than reflexively adjusting material curves.
Why Correlation Is Hard: A Concrete Illustration
Consider a 64 km/h ODB test where the CAE model predicts a peak left-front longitudinal rail crush of 412 mm, while the test measured 385 mm. The naive response is to soften the rail material. But the 27 mm difference could equally come from: a barrier honeycomb face with higher-than-nominal crush strength; a weld pattern in the test body that differed from the CAE assumption; or hourglass energy in the rail exceeding 5% of internal energy, artificially stiffening the response. Before touching the material card, the engineer checks the model's energy balance, the barrier face calibration, and the as-built weld map. Only when those are cleared does material adjustment become legitimate.
This is the central discipline of the course: diagnose before you tune. A model that matches by compensating errors will fail on the next variant.
Metrics Used to Judge Agreement
Correlation is quantified with several complementary metrics. No single number is sufficient.
- Peak value and time-of-peak — the simplest and most physically meaningful for structural crush and occupant loading.
- Pulse shape comparison — integral of acceleration over the event, and the duration above a threshold.
- CORrelation factor (COR) — a normalized cross-correlation between test and CAE signals, sensitive to phase and shape.
- ANOVA-based rating — used in some OEM internal standards to score magnitude, phase, and shape separately.
- Intrusion and deformation maps — geometric comparison at defined sections, often from 3D scan of the tested body.
A practical acceptance band used in many programmes is ±15% on peak acceleration and ±10% on structural intrusion, with COR above 0.85 for primary channels. These are programme-dependent and must be stated explicitly in the correlation plan.
Course Scope and Structure
This course follows the actual engineering sequence. It begins with test planning and instrumentation, moves through model build and material characterization, then into the correlation process itself — signal processing, metric computation, residual diagnosis, and model update. Later chapters cover specific event types (frontal, side, pole, sled), occupant restraint correlation, and the documentation and sign-off that makes a correlation defensible to regulators and management.
What You Will Be Able to Do
After completing this course, you should be able to:
- Write a correlation plan that defines events, channels, metrics, and acceptance criteria before any test is run.
- Process test and CAE signals through identical filtering and alignment procedures.
- Compute and interpret peak, pulse, COR, and intrusion metrics.
- Attribute residuals to test variability, modeling idealization, or numerical error using energy balance and diagnostic checks.
- Decide when a model is fit for a given predictive purpose and document that decision.
The next chapter begins with test planning: how to define the event matrix, select instrumentation, and establish the boundary conditions that the CAE model must reproduce.