1. Crash pulse fundamentals
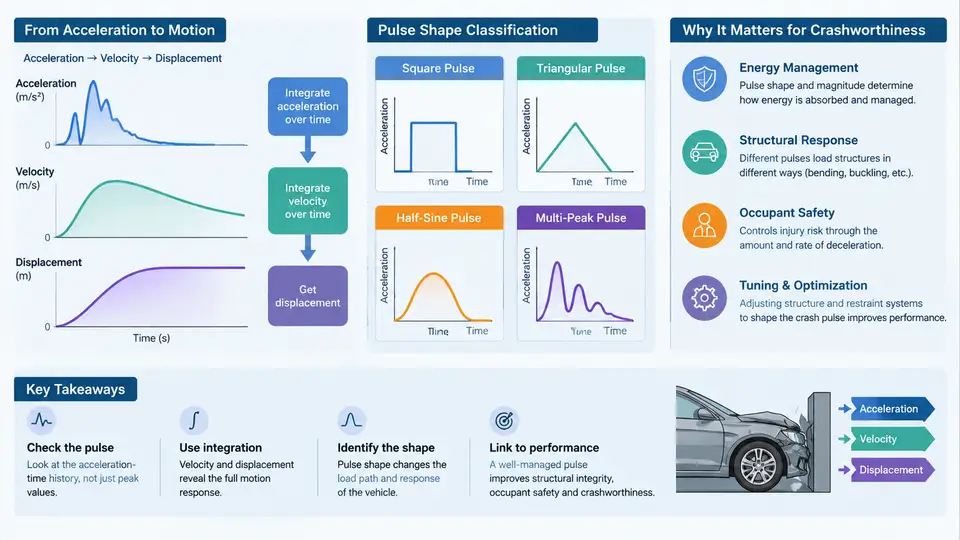
A crash pulse is the acceleration–time history measured at a selected point on the vehicle body during an impact event. It is the single most compact description of how the vehicle's structure and restraint systems interact with an occupant or a component during a collision. In practice, the pulse is recorded by accelerometers mounted on the vehicle body (typically at the B-pillar base, rocker, or floor pan) and is expressed as a(t) in units of g (1 g = 9.81 m/s²). Everything downstream — occupant injury metrics, airbag deployment timing, seatbelt load limiter tuning, and structural crush targets — is derived from this one signal.
1.1 Acceleration–Time History and Sign Convention
Before any analysis, the sign convention must be fixed and held consistently throughout the entire project. The most common convention in vehicle crashworthiness is:
- Positive acceleration = deceleration of the vehicle in the direction of travel (i.e., the vehicle is slowing down). This is the convention used in most OEM pulse specifications and in FMVSS 208 / Euro NCAP test reports.
- Negative acceleration = rebound or rearward acceleration after the primary crush phase.
If a different convention is used (for example, SAE J211 with the opposite sign), it must be stated explicitly at the top of every plot and table. Mixing conventions is one of the most common sources of error in pulse comparison studies.
A typical frontal barrier pulse has three recognizable phases:
- Ramp-up (0–15 ms): the bumper, crash box, and front rails begin to crush. Acceleration rises from zero to a first peak.
- Plateau / oscillation (15–60 ms): the main energy-absorbing structure deforms. The pulse shows a series of peaks and valleys caused by folding of sheet-metal members and by engine/transmission inertia loading.
- Rebound (60–120 ms): the vehicle decelerates to zero velocity and then reverses direction slightly. Acceleration crosses zero and becomes negative.
1.2 Velocity and Displacement by Integration
The acceleration signal alone does not tell the engineer how much the vehicle moved or how fast it was going at any instant. Those quantities are obtained by numerical integration. Using the trapezoidal rule on a sampled signal with time step Δt:
v[i] = v[i-1] + 0.5 * (a[i] + a[i-1]) * Δt
d[i] = d[i-1] + 0.5 * (v[i] + v[i-1]) * Δt
Two practical rules govern this integration:
- Initial velocity:
v[0]must be set to the impact velocity (e.g., 56 km/h = 15.56 m/s for a frontal rigid barrier test). If it is set to zero, the resulting displacement will be meaningless. - Drift correction: real accelerometer signals contain low-frequency drift and offset. Before integration, apply a high-pass filter (typically 1–5 Hz) or a linear drift removal. Without this, the integrated velocity will not return to zero at the end of the event, and the displacement curve will diverge.
As a worked example, consider a simplified pulse sampled at 1 kHz with a constant 30 g plateau lasting 40 ms. The velocity change is:
Δv = 30 * 9.81 * 0.040 = 11.77 m/s ≈ 42.4 km/hIf the initial velocity was 15.56 m/s, the vehicle would still be moving at 3.79 m/s after the plateau. The remaining pulse must therefore provide additional deceleration to bring the vehicle to rest. This simple check — does the integrated velocity reach zero at the end of the event? — is the first validation step for any measured pulse.
1.3 Pulse Shape Classification
Pulse shapes are classified by their temporal profile and by the frequency content they impose on the occupant. The three canonical shapes are:
| Shape | Time to peak | Typical source | Occupant effect |
|---|---|---|---|
| Square / rectangular | Very short (<5 ms) | Rigid barrier, stiff structure | High peak force, high injury risk |
| Triangular | Moderate (10–20 ms) | Progressive crush structure | Moderate force, better ride-down |
| Haversine / bell | Long (20–40 ms) | Optimized energy absorber | Low peak force, best ride-down |
The key metric linking pulse shape to occupant protection is ride-down efficiency. It is defined as the fraction of the vehicle's kinetic energy that is dissipated by structural deformation before the occupant contacts the restraint system. A pulse with a long, smooth rise allows the occupant to "ride down" the deceleration, reducing the relative velocity between occupant and vehicle at the moment of belt/airbag engagement.
1.4 Significance in Vehicle Crashworthiness
The crash pulse is the boundary condition for every downstream safety system. Its peak value and duration determine:
- Airbag deployment timing: the airbag must be fully inflated before the occupant moves forward into the deployment zone. This is typically 20–30 ms after impact for a 50 km/h frontal test.
- Seatbelt load limiter setting: the limiter force is tuned so that the belt pays out at a rate matching the occupant's deceleration profile.
- Structural crush targets: the front rail must absorb a specified amount of energy within a defined stroke. If the pulse is too short, the stroke is insufficient; if too long, the occupant compartment may be compromised.
- Occupant injury criteria: HIC (Head Injury Criterion), chest deflection, and femur load are all computed from the occupant's response to the pulse, not from the pulse itself.
Engineering takeaway: A crash pulse is not just a measurement — it is a design specification. Changing the pulse shape changes the entire restraint system calibration. This is why pulse management and structural tuning are treated as a single, coupled discipline.
1.5 Visualizing the Pulse and Its Integrals
The SVG below shows a representative frontal crash pulse with its integrated velocity and displacement curves. The three phases (ramp-up, plateau, rebound) are annotated, and the zero-velocity crossing is marked. This is the standard format used in pulse review meetings.
The acceleration curve (solid blue) shows the characteristic double-peak structure of a front-rail-dominated pulse. The velocity curve (dashed green) decreases monotonically until it crosses zero at approximately 78 ms, indicating the end of the primary deceleration phase. The displacement curve (dotted orange) rises continuously and reaches its maximum at the same instant, representing the total dynamic crush of the front structure. If the displacement at v = 0 does not match the measured residual crush plus elastic recovery, the pulse integration is suspect and the raw signal should be re-examined for drift or saturation.
Practical check: Always plot a(t), v(t), and d(t) on the same time axis. A pulse that looks reasonable in acceleration may reveal a velocity offset or a displacement divergence that indicates a sensor or filtering problem.
1.6 Summary
The crash pulse is the foundational signal of vehicle crashworthiness. Its acceleration–time history defines the loading environment; its integrals give velocity and displacement, which are the quantities that actually govern occupant motion and structural crush. Pulse shape — square, triangular, or haversine — determines ride-down efficiency and therefore injury risk. Every restraint calibration, every structural crush target, and every occupant simulation starts from this signal. Mastering the pulse means mastering the boundary condition of the entire safety system.