4. Sensor and measurement systems for seatb
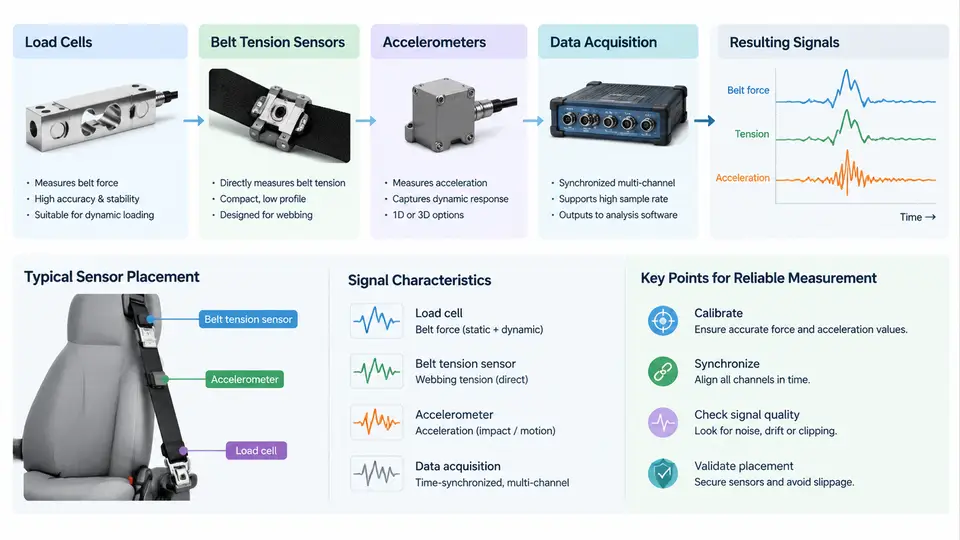
Seatbelt force measurement is the backbone of restraint performance analysis. Whether you are validating a pretensioner, tuning a load limiter, or correlating a sled test with a CAE model, the quality of your conclusions is bounded by the quality of your measurement chain. This chapter examines the four core elements of that chain: load cells, belt tension sensors, accelerometers, and the data acquisition (DAQ) system that ties them together.
Load Cells: Measuring Force at the Anchor Points
A load cell converts mechanical force into an electrical signal, most commonly via strain gauges bonded to a compliant element. In seatbelt applications, the most frequent locations are the retractor anchor, the buckle stalk, and the outboard lap anchor. Each location imposes different constraints on range, stiffness, and geometry.
For a buckle-side measurement, a typical configuration uses a tension/compression load cell rated at 20 kN with a safe overload of 150%. The cell is inserted between the buckle and its mounting bracket. Because the buckle stalk is part of the occupant's load path, the cell must be stiff enough not to alter the restraint dynamics. A common rule of thumb is that the added compliance should not exceed 5% of the original stalk stiffness. If the cell is too soft, the measured force will lag the true occupant load and the pretensioner stroke will appear longer than it actually is.
Strain-gauge load cells are wired in a Wheatstone bridge. A quarter-bridge configuration is sensitive to temperature and lead resistance; a full bridge with four active gauges is preferred for belt force work because it cancels bending and temperature effects. The bridge excitation is typically 5 V DC or 10 V DC, and the full-scale output is around 2 mV/V. With a 10 V excitation, that yields 20 mV at rated load — a small signal that demands a low-noise amplifier and careful shielding.
Belt Tension Sensors: Force Along the Webbing
Load cells at the anchors measure the force transmitted to the vehicle structure. Belt tension sensors measure the force carried by the webbing itself, which is what the occupant's chest and pelvis actually experience. The two are related but not identical, because friction at the D-ring, the retractor, and the buckle changes the force distribution along the belt path.
The most common belt tension sensor is a through-shaft or in-line load cell that replaces a section of the webbing path. A segment of belt is routed over a low-friction roller mounted on a load cell; the resultant force on the roller is proportional to the belt tension. The geometry matters: if the belt wraps the roller through an angle θ, the measured force is Fmeasured = 2·T·sin(θ/2), where T is the belt tension. For a 90° wrap, the factor is 1.414; for 180°, it is 2.0. This means the sensor must be calibrated for the specific wrap angle used in the test fixture.
An alternative is a buckle force sensor, which measures the force between the buckle and the tongue. This is mechanically simpler but captures only the buckle-side tension, not the shoulder belt tension. For a complete picture of restraint loading, you generally need at least two belt tension measurements: one on the shoulder belt and one on the lap belt.
Accelerometers: Capturing the Motion Context
Force alone does not describe a restraint event. You also need to know how the occupant and the vehicle are moving. Accelerometers provide that context. In a typical sled or crash test, accelerometers are placed on the vehicle structure (to measure the crash pulse), on the seat frame, and on the occupant's chest and pelvis (to measure occupant kinematics).
Piezoresistive accelerometers are preferred for crash testing because they can measure DC (steady-state) acceleration, which is important for determining occupant position before impact. Piezoelectric accelerometers cannot measure DC and are therefore less suitable for occupant-mounted measurements where the initial orientation matters. A typical chest accelerometer has a range of ±500 g and a frequency response from DC to 1,500 Hz. The vehicle structure accelerometer may need a range of ±2,000 g to capture the harsh crash pulse without clipping.
Accelerometer mounting is critical. A loose or resonating mount will produce artifacts that look like real occupant motion. Stud mounting is best; adhesive mounting is acceptable for occupant sensors but must be checked before every test. The accelerometer's sensitive axis must be aligned with the direction of interest, and the alignment should be documented in the test setup sheet.
Data Acquisition: Sampling, Filtering, and Synchronization
The DAQ system is where all signals converge. For seatbelt force analysis, the key requirements are sample rate, anti-alias filtering, and channel synchronization.
SAE J211 specifies a channel frequency class (CFC) for crash test data. Belt force and occupant acceleration are typically recorded at CFC 600, which requires a sample rate of at least 6,000 samples per second (10× the cutoff frequency). Many labs use 10 kHz or 20 kHz to provide margin. The anti-alias filter must be applied before sampling; a common mistake is to sample at 10 kHz and then apply a digital filter, which does not remove aliased content.
All channels must be time-synchronized to within 1 ms. In practice, this means using a single DAQ chassis with a common clock, or a distributed system with hardware time synchronization (e.g., IEEE 1588 PTP). A time offset between the force and acceleration channels will corrupt any correlation analysis and can make a well-designed restraint system appear to have a phase lag.
Example DAQ configuration for a seatbelt force test:
- Sample rate: 20,000 Hz per channel
- Anti-alias filter: 4-pole Butterworth, -3 dB at 3,000 Hz
- Excitation: 10 V DC for load cells
- Bridge completion: full bridge, 350 Ω gauges
- Synchronization: hardware trigger, common clock
- Channels: 2× belt tension, 1× buckle load, 2× occupant accel, 1× vehicle accelPutting the Chain Together
The measurement chain is only as strong as its weakest link. A high-quality load cell connected to a poorly grounded DAQ will produce noisy data. A well-calibrated accelerometer mounted with a loose bracket will produce false peaks. The following SVG illustrates the complete signal chain from the occupant's belt path to the recorded data, highlighting the key components and the points where errors are most likely to enter.
The diagram shows the signal path from the occupant and belt path through the sensors, signal conditioning, and DAQ system. The red dashed branches identify the three most common error sources at each stage. The verification checks at the bottom are the minimum set that should be performed before accepting any seatbelt force data.
Practical Calibration and Verification
Before a test, each load cell should be calibrated with a known dead weight or a calibrated force standard. A typical procedure is to apply five load steps from 0 to 100% of rated capacity, record the output at each step, and compute the least-squares linearity. The deviation from best-fit straight line should be less than 0.5% of full scale. If it is not, the cell may be damaged or the bridge completion resistors may be mismatched.
For belt tension sensors, calibration must replicate the actual wrap angle. A simple fixture with a known weight and the same roller geometry as the test setup is sufficient. Record the calibration factor in mV/N and verify it with a second weight at a different load level.
Accelerometers can be checked with a handheld shaker or a back-to-back comparison with a reference accelerometer. The sensitivity should match the manufacturer's calibration sheet within 2%. Any deviation greater than that suggests a mounting problem or a damaged sensor.
During the test, monitor the zero offset of each force channel. A shift of more than 1% of full scale after the test indicates that the sensor was overloaded or that the mounting loosened. In that case, the data should be flagged and the test repeated if possible.
Summary
Seatbelt force measurement requires a chain of components that are individually calibrated and collectively synchronized. Load cells at the anchors and belt tension sensors on the webbing capture the force distribution; accelerometers provide the kinematic context; and the DAQ system ensures that all signals are sampled, filtered, and time-aligned correctly. The most common failures are not sensor failures but installation and configuration errors: loose mounts, wrong wrap angles, insufficient anti-alias filtering, and time offsets. By verifying each stage of the chain before and after the test, you can ensure that the data you use for restraint performance analysis is trustworthy.