4. Sled test systems
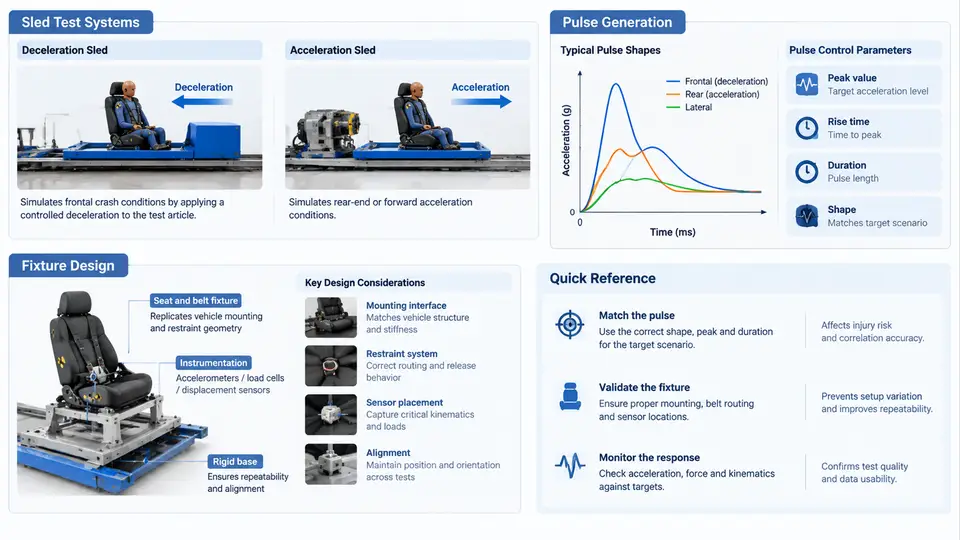
Sled testing is the workhorse of occupant restraint correlation engineering. It reproduces the crash pulse measured on a full vehicle, but in a controlled, repeatable, and instrumented environment where the body structure is replaced by a rigid buck. The value of a sled test depends entirely on how faithfully the pulse, the fixture, and the restraint boundary conditions represent the real event. This chapter examines the two dominant sled architectures, how pulses are generated and verified, and how fixtures are designed so that sled results correlate with vehicle results.
Deceleration Sled vs. Acceleration Sled
A deceleration sled accelerates the test buck to a target velocity and then decelerates it through a programmable energy-absorbing device. The buck carries the occupant, seats, restraints, and instrumentation; the pulse is imposed on the buck, and the occupant loads the restraints exactly as in a frontal crash. Deceleration sleds are the standard for frontal occupant restraint work because the occupant kinematics are driven by the same inertial mechanism as in the vehicle. Typical systems use a tow cable or hydraulic launch to reach 30–64 km/h, then a set of crushable metal tubes, hydraulic dampers, or a servo-controlled brake generates the deceleration pulse.
An acceleration sled reverses the arrangement: the buck starts at rest and is accelerated by a pusher, typically a hydraulic actuator or a spring/cable system, to a target velocity while the pulse is applied. Acceleration sleds are common for rear-impact (whiplash) testing, side-impact component work, and some battery/module tests, where the pulse shape is easier to control in the acceleration direction. The key distinction for correlation is that the occupant experiences the same inertial loading in both cases, but the fixture and instrumentation mounting differ, and the pulse sign convention must be handled carefully.
Pulse Generation and Verification
The crash pulse is the single most important input to a sled test. It is defined by three parameters: velocity change (Δv), peak deceleration, and pulse duration. A typical frontal pulse might be Δv = 56 km/h, peak = 35 g, duration = 100 ms, with a shape that rises quickly, holds, and decays. The pulse shape determines occupant kinematics: a higher peak with shorter duration produces more severe loading, while a longer, lower pulse allows more ride-down.
Pulse generation methods include:
- Crushable tubes: Metal tubes of calibrated wall thickness and length are crushed by the sled, producing a roughly square pulse. The tube length sets the stroke and thus the duration; wall thickness sets the force level.
- Hydraulic dampers: A servo-controlled orifice or a set of fixed orifices produces a shaped pulse. Programmable dampers allow pulse shaping without changing hardware.
- Servo-hydraulic brake: Closed-loop control adjusts braking force in real time to track a target pulse. This is the most flexible but requires a validated controller.
Verification is mandatory. The measured buck acceleration is filtered per SAE J211 (typically CFC 60 for the buck, CFC 180 for occupant responses) and compared to the target. Acceptance criteria usually require the measured Δv within ±1 km/h, peak within ±10%, and the pulse corridor within a defined tolerance band. A common failure is a pulse that meets Δv but has the wrong shape, which changes occupant timing and invalidates correlation.
Fixture Design for Restraint Correlation
The fixture is where correlation is won or lost. A sled buck must reproduce the vehicle's structural interface at the restraint attachment points, not the entire body. The design goal is to match the local stiffness and geometry at the seat, belt anchors, airbag mounting, and knee bolster, while keeping the buck rigid enough that it does not introduce its own compliance.
Key fixture design principles:
- Anchor point fidelity: Belt anchor locations, seat track positions, and airbag module mounting angles must match the vehicle within a few millimeters. A 10 mm shift in a D-ring can change belt geometry and occupant loading.
- Local stiffness matching: If the vehicle structure deforms at the anchor, the fixture should include a representative bracket or a tuned compliance element. A fully rigid fixture can over-constrain the restraint and produce non-conservative results.
- Mass and inertia: The buck mass should represent the vehicle mass at the restraint interface. Adding mass changes the pulse and occupant timing.
- Instrumentation access: Load cells at belt anchors, seat tracks, and airbag mounts must be installed without altering the load path. Strain gauges on fixture brackets help verify that the fixture is not absorbing energy intended for the restraint.
Correlation Workflow and Acceptance
A typical sled correlation workflow proceeds as follows. First, the vehicle crash pulse is extracted and filtered. Second, the sled pulse is tuned to match Δv, peak, and shape. Third, the fixture is instrumented and static stiffness checks are performed. Fourth, the sled test is run with the same ATD, restraint hardware, and seating position as the vehicle test. Fifth, occupant responses (head acceleration, chest deflection, belt loads, femur loads) are compared to the vehicle results.
Acceptance criteria for correlation are project-specific but commonly include: head resultant acceleration within ±15%, chest deflection within ±10%, belt load within ±15%, and occupant kinematics timing within ±10 ms. If correlation fails, the engineer must isolate whether the cause is the pulse, the fixture, or the restraint. A useful diagnostic is to run the sled with the vehicle pulse and the vehicle fixture stiffness; if the response still diverges, the restraint itself or the ATD setup is the likely cause.
| Parameter | Typical Target | Acceptance Band | Common Failure Cause |
|---|---|---|---|
| Δv | 56 km/h | ±1 km/h | Tow speed error, brake release timing |
| Peak deceleration | 35 g | ±10% | Tube wall thickness, damper orifice |
| Pulse duration | 100 ms | ±5 ms | Stroke length, crush tube length |
| Head accel (HIC) | Vehicle result | ±15% | Fixture stiffness, belt geometry |
| Chest deflection | Vehicle result | ±10% | Seat back angle, belt load limiter |
| Belt anchor load | Vehicle result | ±15% | Anchor location, fixture compliance |
Example: Frontal Sled Correlation Setup
Consider a frontal correlation test for a driver restraint system. The vehicle pulse is Δv = 56 km/h, peak = 38 g, duration = 95 ms. The sled is configured with a deceleration sled and a set of crush tubes selected to produce a square pulse. The buck mass is set to 1,200 kg to represent the vehicle front structure. The seat is mounted on a fixture that reproduces the vehicle seat track stiffness, and belt anchors are placed at the vehicle coordinates. A HIII 50th percentile ATD is seated per the vehicle test setup.
After the test, the measured buck pulse is Δv = 56.2 km/h, peak = 37.5 g, duration = 96 ms, which is within the acceptance band. The ATD head resultant acceleration is 72 g versus 68 g in the vehicle, a 5.9% difference. Chest deflection is 32 mm versus 34 mm, a 5.9% difference. Belt anchor load is 4.2 kN versus 4.0 kN, a 5% difference. The correlation is acceptable. The engineer notes that the slightly higher head acceleration may be due to a marginally stiffer seat fixture and recommends a compliance check on the seat track bracket before the next test.
In summary, sled correlation engineering requires a disciplined approach: select the correct sled architecture, generate and verify the pulse against the vehicle, design fixtures that reproduce local stiffness and geometry, and compare occupant responses with defined acceptance criteria. The sled is not a substitute for the vehicle test; it is a controlled instrument for isolating restraint performance, and its value depends on how carefully its boundary conditions are matched to the real event.