4. Inflator output characterization
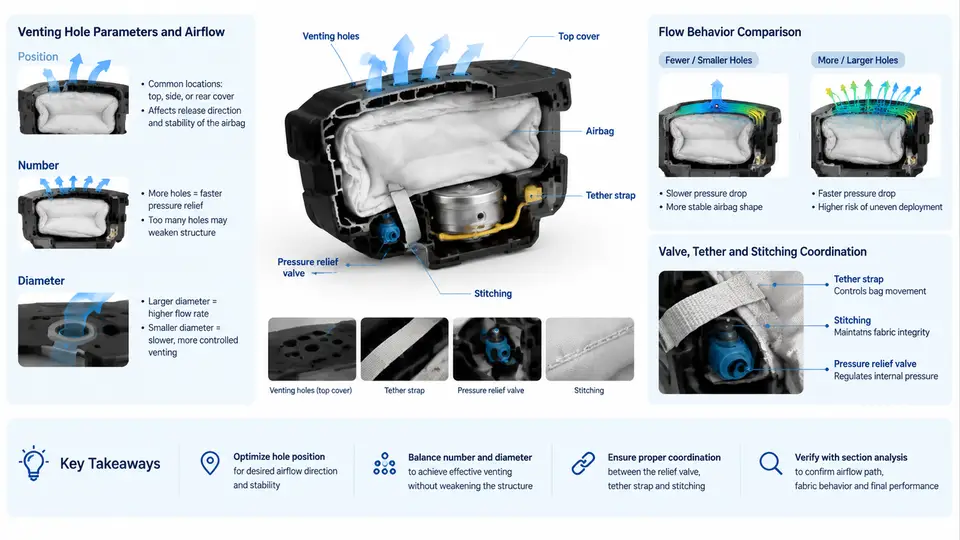
An airbag's venting design cannot be finalized from inflator datasheets alone. The vent area, vent hole count, and fabric permeability must be matched to the actual gas delivery profile of the inflator under the conditions it will see in a real deployment. That profile is established through tank tests, which convert an inflator's pyrotechnic or hybrid output into measurable pressure–time and temperature data. This chapter explains how tank tests are run, how the resulting data is reduced to mass flow rate, and how gas temperature influences the venting calculation.
Why Tank Tests Are the Reference Measurement
A tank test fires the inflator into a sealed, known-volume pressure vessel and records the pressure rise over time. Because the tank volume is fixed and the gas is confined, the pressure history is a direct proxy for the mass and energy delivered by the inflator. The two standard configurations are:
- Closed tank test — a rigid vessel with no venting. Used to characterize total gas output, peak pressure, and the effective gas temperature via the ideal-gas relation.
- Vented tank test — a vessel with a calibrated orifice or vent. Used to characterize the coupled behavior of inflator output and venting, which is closer to the real airbag module.
The closed tank is the primary characterization tool because it isolates the inflator from the venting hardware. The vented tank is then used to validate that the venting design produces the intended pressure–time curve.
Instrumentation and Data Acquisition
A typical closed tank setup includes:
- A steel tank of known internal volume, commonly 60 L or 100 L for driver and passenger inflators.
- Piezoelectric or piezoresistive pressure transducers mounted flush with the tank wall, with a sampling rate of at least 10 kHz to resolve the initial pressure spike.
- Thermocouples or a gas temperature probe at one or more locations to estimate the mean gas temperature.
- A current probe on the inflator squib to record the firing command and confirm initiation timing.
- A data acquisition system that time-aligns pressure, temperature, and current channels to within 0.1 ms.
The tank is conditioned to a specified ambient temperature before firing. For automotive qualification, tests are typically run at −35 °C, 23 °C, and 85 °C to capture the temperature sensitivity of the propellant and the gas.
Reducing Pressure–Time Data to Mass Flow Rate
The raw output of a closed tank test is a pressure–time curve P(t) and a gas temperature T(t). Assuming the gas behaves ideally and the tank volume V is constant, the mass of gas in the tank at any time is:
m(t) = P(t) · V / (R · T(t))where R is the specific gas constant of the combustion products. For a typical hybrid inflator, R is approximately 280–320 J/(kg·K), depending on the argon–helium–propellant mixture. The instantaneous mass flow rate is then the derivative:
ṁ(t) = dm/dt = (V / R) · d/dt [ P(t) / T(t) ]In practice, T(t) is difficult to measure directly because the gas is hot and non-uniform. A common engineering approach is to assume a constant effective gas temperature Teff derived from the peak pressure and the known total gas mass, then compute ṁ(t) from the pressure derivative alone:
ṁ(t) ≈ (V / (R · T_eff)) · dP/dtThis simplification is valid after the initial mixing transient, typically 5–10 ms after initiation. The initial spike must be treated separately because the gas has not yet equilibrated with the tank walls.
m = (2.4 × 105 Pa × 0.060 m3) / (300 J/(kg·K) × 900 K) = 0.0533 kg
If the pressure rises from 2.4 bar to 2.6 bar over the next 2 ms, the average mass flow rate in that interval is:
ṁ ≈ (0.060 / (300 × 900)) × (0.2 × 10⁵ / 0.002) ≈ 0.00222 kg/s per unit...
Carrying the full calculation: Δm = (0.2 × 105 × 0.060) / (300 × 900) = 0.00444 kg over 0.002 s, giving ṁ ≈ 2.22 kg/s. This is a representative order of magnitude for a driver inflator during its main gas delivery phase.
Gas Temperature Effects on Venting Design
The gas temperature is not a minor correction — it directly scales the mass flow rate and therefore the pressure that the vent must relieve. Two effects matter:
- Temperature changes gas density. For a fixed pressure, hotter gas is less dense, so a given vent area passes less mass per unit time. If the venting design assumes a cold gas density, it will over-vent when the gas is hot.
- Temperature changes the speed of sound. Choked flow through a vent depends on the sonic velocity c = √(γRT). Hotter gas has a higher sonic velocity, which increases the mass flow capacity of a fixed vent area.
These two effects partially offset each other, but not exactly. The net result is that the vent mass flow rate scales approximately with P/√T for choked flow. A 20 % increase in absolute gas temperature reduces the vented mass flow by roughly 9 % at constant pressure. That is enough to shift the peak bag pressure by several kilopascals, which can matter for occupant injury criteria.
From Tank Data to Venting Design
The workflow from characterization to venting design follows a clear sequence. The closed tank test gives the total gas mass mtotal and the effective gas temperature Teff. The vented tank test gives the pressure–time curve for a known vent area Avent. The venting designer then scales Avent to match the target bag pressure–time curve, using the mass flow rate relation:
ṁ_vent = C_d · A_vent · P_bag / √(R · T_gas) · f(γ)where Cd is the discharge coefficient of the vent (typically 0.6–0.8 for fabric vents), Pbag is the instantaneous bag pressure, and f(γ) is a compressible flow function. The designer iterates Avent until the simulated bag pressure matches the target at all qualification temperatures.
Practical Considerations and Common Pitfalls
Several issues routinely appear when tank-test data is used for venting design:
- Ignoring the initial transient. The first 5–10 ms of the pressure record contains the inflator's internal combustion and mixing dynamics. Using the ideal-gas relation in this window underestimates the gas temperature and overestimates the mass flow rate. Fit Teff only after the pressure curve becomes smooth.
- Using a single R value. Hybrid inflators store argon and helium at high pressure, and the combustion products add CO2, H2O, and N2. The effective R changes as the gas composition evolves. For accurate work, use a composition-weighted R or calibrate against a known gas mass.
- Neglecting tank wall heat loss. A steel tank absorbs heat from the hot gas, which lowers the measured pressure. For long-duration records (> 100 ms), apply a heat-loss correction or use a tank with a known thermal time constant.
- Assuming vent flow is always choked. Near the end of deployment, the bag pressure drops below the critical pressure ratio and the vent flow becomes subsonic. The venting calculation must switch to the subsonic branch, or the predicted bag pressure will be too low.
Summary
Tank tests are the foundation of inflator output characterization. The closed tank provides the total gas mass and effective gas temperature; the pressure–time record is reduced to mass flow rate using the ideal-gas relation and its derivative. Gas temperature enters the venting design through both density and sonic velocity, with a net choked-flow scaling of ṁ ∝ P/√T. The vented tank test then validates the chosen vent area against the target bag pressure–time curve at all qualification temperatures. By treating the tank data as the authoritative input and accounting for temperature effects explicitly, the venting designer can avoid the common failure modes of over-venting at high temperature and under-venting at cold deployment.