1. Airbag system architecture and venting f
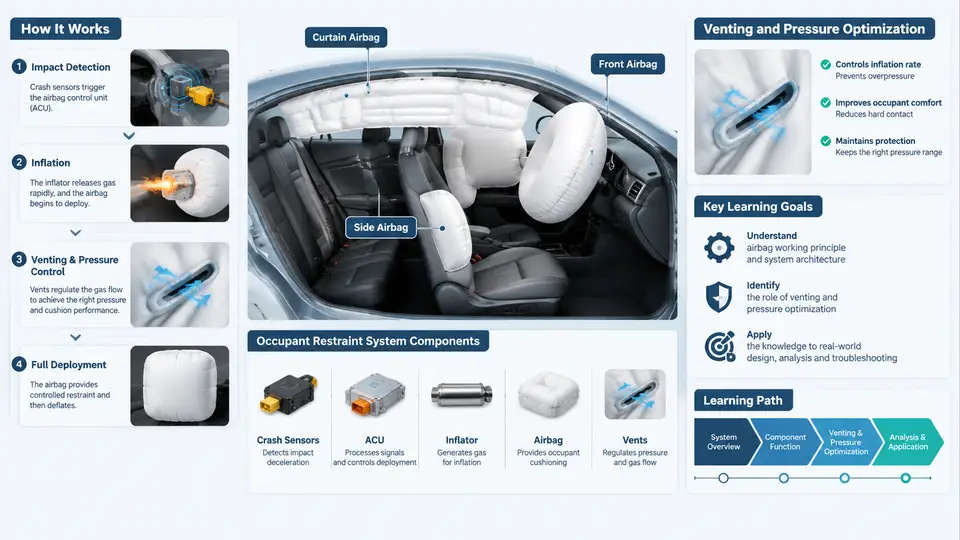
An airbag is not a bag that simply fills with gas. It is a pressure-managed energy absorber whose performance depends on how gas is generated, how the cushion expands, and how that gas is deliberately allowed to escape. The venting path is therefore a first-class design element, not an afterthought. This chapter establishes the architecture vocabulary and the physical relationships that every later optimization decision builds on.
1.1 System architecture overview
A frontal driver airbag system consists of four functional blocks that operate in a closed loop within roughly 100 ms:
- Crash sensing and decision: accelerometers and a safing sensor feed the Airbag Control Unit (ACU). The ACU applies a discrimination algorithm and issues a deployment command only when the crash severity and direction fall inside the calibrated firing window.
- Inflator: converts stored chemical or compressed-gas energy into inflation gas. The inflator defines the gas mass flow rate and the gas temperature, which together set the upper bound of achievable cushion pressure.
- Cushion: the fabric envelope that receives the gas, distributes it, and contacts the occupant. Its geometry, seam pattern, and fabric permeability determine how pressure is distributed and how quickly the cushion can absorb energy.
- Venting path: the controlled openings — vent holes, permeable fabric, or active valves — through which gas leaves the cushion. Venting converts the cushion from a rigid pressure vessel into a tunable spring-damper.
The occupant is the fifth element in the loop: the cushion must be soft enough to limit chest acceleration, yet firm enough to prevent bottoming-out against the module or steering wheel. Venting is the primary tuning knob that balances these two requirements.
1.2 Inflator types and their pressure signatures
Three inflator families dominate passenger-vehicle applications, and each produces a distinctly different pressure-time curve.
| Type | Gas source | Typical fill time | Pressure character |
|---|---|---|---|
| Pyrotechnic | Solid propellant combustion | 20–40 ms | Fast rise, hot gas, high peak |
| Hybrid | Propellant + stored compressed gas | 30–50 ms | Moderate rise, cooler gas, flatter plateau |
| Stored gas (cold gas) | Compressed argon/helium | 40–70 ms | Slow rise, low temperature, gentle peak |
Pyrotechnic inflators deliver gas almost explosively, so the cushion reaches peak pressure early and then relies heavily on venting to shed energy. Stored-gas inflators fill more gradually, which reduces peak pressure but requires a larger gas reservoir. Hybrid inflators sit between the two and are common in passenger-side applications where a larger cushion volume must be filled without excessive peak pressure.
1.3 Cushion geometry and its effect on pressure
Cushion volume is the single most important geometric parameter. For a given gas mass, pressure is inversely related to volume through the ideal-gas relationship:
P · V = m · R · T

P = cushion pressure (absolute)
V = cushion volume at the moment of interest
m = mass of gas inside the cushion
R = specific gas constant
T = absolute gas temperature
This means a larger cushion naturally runs at lower pressure, which is why passenger-side cushions (80–120 L) operate at lower peak pressures than driver-side cushions (50–70 L) using comparable inflators. Geometry also controls how pressure is distributed: a cushion that is too shallow bottoms out against the module, while one that is too deep may not contact the occupant early enough.
Seam placement and tether design shape the deployed envelope. Tethers limit how far the cushion can extend, and their length directly changes the effective volume at peak pressure. A shorter tether reduces volume, raises pressure, and stiffens the cushion — a trade-off that must be balanced against occupant ride-down.
1.4 Vent hole placement and sizing
Vent holes are the deliberate leak paths. Their location and diameter determine both the rate and the timing of pressure decay.
- Placement: Vents are typically located on the side panels or the rear face of the cushion, away from the occupant contact zone. Placing a vent in the contact zone risks fabric damage and unpredictable flow. Rear-face vents are common on driver cushions because they exhaust toward the steering wheel rather than the occupant.
- Diameter: Vent area scales with the square of diameter. Doubling the diameter roughly quadruples the discharge area and dramatically shortens the pressure plateau. Typical driver-side vent diameters range from 20 mm to 40 mm, often with two symmetric vents.
- Symmetry: Asymmetric venting creates a pressure gradient across the cushion, which can cause the cushion to rotate or shift during deployment. Symmetric vent pairs are preferred unless a specific deployment trajectory is required.
- Permeability: Woven fabric itself leaks gas. Coated fabrics reduce permeability, making vent holes the dominant discharge path and improving repeatability.
1.5 Pressure-time curve basics
The pressure-time (P-t) curve is the primary diagnostic and tuning artifact. It has four recognizable phases:
- Rise phase (0–30 ms): Gas enters faster than it escapes. Pressure climbs steeply. The slope is set by the inflator mass flow rate.
- Peak (20–40 ms): Inflow and outflow reach balance. Peak pressure must be high enough to arrest occupant motion but low enough to limit chest deflection.
- Plateau / decay (40–80 ms): Inflow drops as the inflator burns out; venting dominates. The decay rate is governed by vent area and cushion permeability.
- Deflation (80–150 ms): The cushion collapses as gas escapes, allowing the occupant to move forward without rebounding.
Two quantitative metrics are extracted from the curve: peak pressure (Pmax) and time to peak (tpeak). A cushion with excessive Pmax or a late tpeak will produce high occupant acceleration; a cushion with insufficient Pmax will bottom out. Venting is the lever that moves both metrics.
1.6 Putting the architecture together
The four blocks form a chain of dependencies. The ACU sets the firing time; the inflator sets the gas supply; the cushion sets the volume and contact geometry; the vent path sets the decay. Changing any one element shifts the P-t curve and therefore the occupant response. In practice, engineers fix the inflator and cushion early in the program, then tune vent area and placement to meet occupant injury criteria — chest deflection, chest acceleration (3 ms clip), and head injury criterion (HIC).
A useful mental model is a spring-damper system: the cushion volume acts as the spring, and the vent area acts as the damper. Too little damping (small vents) produces a stiff, rebounding cushion; too much damping (large vents) produces a cushion that collapses before the occupant is fully restrained. The target is a critically damped response that absorbs energy without rebound.
1.7 Key takeaways
- Airbag performance is governed by the interaction of inflator output, cushion volume, and vent discharge — not by any single component.
- Inflator type determines the shape of the pressure rise; cushion geometry determines the pressure level; venting determines the decay.
- Vent placement should avoid the occupant contact zone and maintain symmetry to prevent cushion rotation.
- The P-t curve's four phases — rise, peak, plateau/decay, and deflation — provide the diagnostic framework for all subsequent tuning.
- Peak pressure and time to peak are the two primary metrics extracted from the curve and are directly controlled by vent area.
With this foundation, the next stage of the course moves from architecture to the quantitative relationships that let you predict how a change in vent diameter or cushion volume will shift the P-t curve before you build a single prototype.