4. Data acquisition and signal processing f
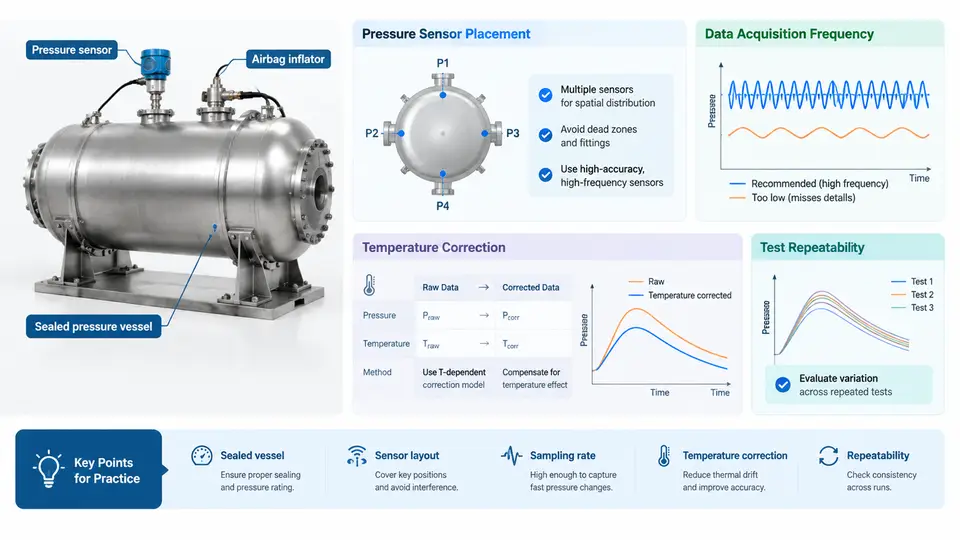
An inflator test produces a short, violent, one-shot event: the pressure vessel may reach peak pressure in 20–60 ms, the tank wall accelerates at thousands of g, and the whole useful record is often over within 200 ms. Because the event cannot be repeated on the same hardware, the measurement chain must be correct before the first trigger. This section covers the four decisions that determine whether the resulting data are defensible: sensor selection, sampling rate, anti-alias filtering, and uncertainty analysis.
Sensor Selection for the Three Primary Channels
Most inflator characterization rigs record at least three channels: tank pressure, tank-wall or fixture acceleration, and a trigger/current marker. Each has different bandwidth and range requirements.
Pressure. A piezoelectric or piezoresistive pressure transducer mounted flush with the tank wall is preferred; a recessed port adds acoustic delay and resonance. For a 60 L tank with a driver-side inflator, peak pressure is typically in the 200–350 kPa range, but the initial shock can momentarily exceed that. Select a transducer with a full-scale range of at least 2× the expected peak (e.g., 0–1000 kPa) and a natural frequency above 100 kHz. Charge-mode piezoelectric sensors require a charge amplifier with a low-frequency cutoff set below 1 Hz to avoid droop during the pressure plateau.
Acceleration. Use IEPE (integrated electronics piezoelectric) accelerometers with a range of ±5000 g or higher for wall-mounted measurements. A 10 mV/g sensitivity sensor saturates at 500 g, which is far too low. Mount the sensor with a stud or adhesive pad directly on the tank surface; any compliant interface acts as a mechanical low-pass filter and corrupts the high-frequency content.
Trigger and current. A current clamp or shunt resistor on the firing line provides both the trigger time zero and a check on the firing pulse shape. Record it on a separate channel with the same time base as the other sensors.
Sampling Rate and Anti-Alias Filtering
The Nyquist criterion requires a sampling rate above twice the highest frequency of interest, but for transient events the practical rule is stricter: sample at 10× the highest frequency you need to resolve. If the accelerometer resonance is at 50 kHz and you want to see the first 5 ms of wall response, a 200 kS/s per-channel rate is a reasonable starting point. For pressure, 100 kS/s is usually sufficient because the transducer itself limits bandwidth.
Every channel must have an analog anti-alias filter before the ADC. A common configuration is a 4-pole Butterworth low-pass with a cutoff at one-fifth of the sampling rate. For a 200 kS/s rate, set the cutoff to 40 kHz. This attenuates content above Nyquist by at least 24 dB per octave, preventing high-frequency accelerometer resonance from folding back into the passband as false low-frequency content.
Uncertainty Analysis
Every reported value—peak pressure, rise time, impulse—carries an uncertainty. A practical uncertainty budget for a tank pressure measurement includes:
| Source | Typical Contribution | Type |
|---|---|---|
| Transducer nonlinearity and hysteresis | ±0.5% FS | B |
| Calibration reference uncertainty | ±0.25% FS | B |
| Charge amplifier gain error | ±0.3% | B |
| ADC quantization (16-bit, ±10 V) | ±0.15% FS | B |
| Repeatability across shots | ±1.2% FS | A |
Combine Type B contributions in quadrature: √(0.5² + 0.25² + 0.3² + 0.15²) ≈ 0.66% FS. The combined standard uncertainty including the Type A term is √(0.66² + 1.2²) ≈ 1.37% FS. For a 300 kPa peak, that is approximately ±4.1 kPa at k = 1, or ±8.2 kPa at k = 2 (95% confidence). Report the coverage factor explicitly.
Signal Processing Workflow
After acquisition, apply a consistent processing chain so that results are comparable across shots and rigs. A typical sequence is:
- Baseline correction. Subtract the mean of a 5 ms pre-trigger window from each channel.
- Digital low-pass. Apply a zero-phase (filtfilt) Butterworth filter at 20 kHz to remove residual noise without shifting the time axis.
- Trigger alignment. Define t = 0 at the 10% rising edge of the current channel.
- Feature extraction. Compute peak pressure, time-to-peak, and impulse (integral of pressure over the first 100 ms) using the same integration limits for every shot.
- Uncertainty propagation. Apply the sensitivity coefficients from the budget to each extracted feature.
The following SVG illustrates the complete measurement chain from sensor to reported value, including the anti-alias filter and the uncertainty budget injection point.
Practical Verification and Common Failure Modes
Before a live test, verify the chain with a known input. A common method is a pulse calibration: inject a step voltage into the charge amplifier and confirm the recorded response matches the expected time constant. If the recorded step shows ringing above the anti-alias cutoff, the filter is not engaged or the cutoff is set too high.
Three failure modes appear repeatedly in inflator testing:
- Aliased accelerometer resonance. The sensor's mounted resonance (often 30–60 kHz) folds into the pressure channel if the anti-alias filter is bypassed. Symptom: a spurious 2–5 kHz oscillation in the pressure trace that does not appear in repeat shots with a different filter setting.
- Charge amplifier overload. The initial shock saturates the amplifier, clipping the first 1–2 ms. Symptom: a flat-topped pressure rise followed by a delayed peak. Remedy: increase the amplifier range or use a lower-sensitivity transducer.
- Trigger jitter. If the current channel is sampled at a different rate or not time-aligned, t = 0 shifts by one sample interval (5 µs at 200 kS/s), which propagates directly into rise-time uncertainty. Always record all channels on the same clock.
With the chain verified and the uncertainty budget documented, the extracted features—peak pressure, time-to-peak, and impulse—carry a known confidence interval. That interval is what makes the comparison between inflator variants or between test and simulation meaningful rather than anecdotal.