4. Material constitutive models for roof cr
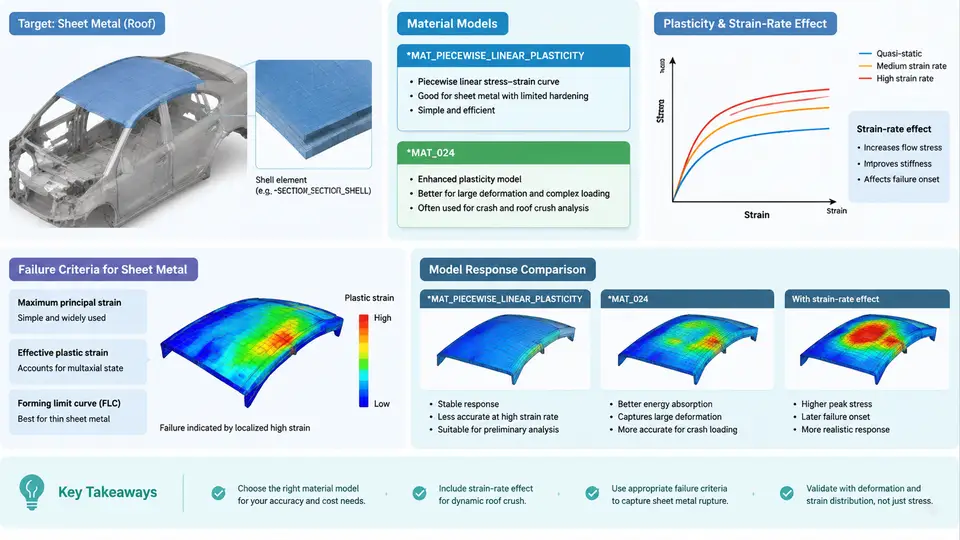
Roof crush simulation in LS-DYNA is dominated by thin-gauge stamped steel: the roof panel, roof bows, A/B/C pillars, and rocker reinforcements. These parts are typically 0.7–2.0 mm thick, formed from HSLA 340/440, DP590, DP780, or boron steel in the hot-stamped condition. Their crash response is governed by three constitutive ingredients: an elastoplastic flow curve, strain-rate sensitivity, and a ductile failure criterion. In LS-DYNA the workhorse for this class of sheet metal is *MAT_PIECEWISE_LINEAR_PLASTICITY, commonly referenced by its material ID *MAT_024 (also aliased as *MAT_PLASTIC_KINEMATIC only when kinematic hardening is activated — the two are distinct cards and should not be confused).
Why *MAT_024 Is the Default Choice
*MAT_024 is an isotropic elastoplastic model with an arbitrary user-defined true stress–plastic strain curve. It supports:
- Piecewise linear hardening via the
LCSSload curve (effective true stress vs. effective plastic strain). - Strain-rate scaling through
LCSScombined with a rate parameterCandP(Cowper–Symonds form) or a tabulated rate curve. - Optional kinematic hardening via
LCSS+LCSSwith theVPflag, useful when reverse loading (springback, folding) matters. - Element deletion driven by
FAIL(effective plastic strain at failure) or by a separate*MAT_ADD_EROSIONcard.
For roof crush, the model is attractive because the input is a single uniaxial tension curve that can be taken directly from a coupon test, and because the rate dependence can be layered on without changing the curve shape.
Building the Input Curve
The LCSS curve must be true stress vs. true plastic strain, not engineering stress–strain. Convert coupon data using:
ε_true = ln(1 + ε_eng)
σ_true = σ_eng * (1 + ε_eng)
ε_pl   = ε_true - σ_true / E
For a DP780 coupon with E = 210 GPa, yield at 480 MPa, and UTS 820 MPa at 0.14 engineering strain, the first few curve points might be:
| ε_pl | σ_true (MPa) |
|---|---|
| 0.000 | 480 |
| 0.020 | 610 |
| 0.060 | 720 |
| 0.120 | 810 |
| 0.180 | 860 |
Extrapolate beyond the uniform elongation limit with a power-law fit (Swift or Voce) rather than a straight line, because roof crush involves local necking and folding where strains exceed the tensile test range. A flat extrapolation will artificially stiffen the hinge and over-predict roof strength.
Strain-Rate Effects
Roof crush occurs at quasi-static to low-rate loading (typically 5–250 mm/min in the FMVSS 216a test, corresponding to strain rates of 10⁻³ to 10⁰ s⁻¹). This is far below the 10²–10³ s⁻¹ range of full frontal crash, so rate sensitivity is modest but not negligible for HSLA and DP steels. Two practical options exist in *MAT_024:
- Cowper–Symonds scaling: set
CandPon the material card. The dynamic yield stress becomes σ_d = σ_s [1 + (ε̇/C)^(1/P)]. For DP780, typical values areC = 4000 s⁻¹andP = 4, giving roughly a 5–8 % yield increase at 1 s⁻¹. - Tabulated rate curves: define multiple
LCSScurves at different rates and let LS-DYNA interpolate. This is more accurate but requires rate-dependent coupon data, which is rarely available for production roof steels.
C = 4000, P = 4 is a defensible default. Document the source of these constants in the material card comment, because they strongly influence the peak force plateau.Failure Criteria for Sheet Metal
Roof crush rarely produces clean tensile failure; it produces local buckling, hinge folding, and eventually tearing at the pillar-to-roof junction or at spot-weld nuggets. Three failure modeling strategies are common:
- Effective plastic strain limit (
FAIL): simplest, but mesh-dependent. A value of 0.25–0.35 is typical for DP780 at 1 mm element size. Not recommended as the sole criterion. - GISSMO (
*MAT_ADD_DAMAGE_GISSMO): the current industry standard for sheet metal. It uses a stress-triaxiality-dependent failure curve and a damage accumulation exponent, and it regularizes mesh sensitivity through the characteristic length. For roof crush, a triaxiality range of −0.3 to +0.3 covers the folding and tearing modes. - Forming Limit Diagram (FLD) based: useful when the roof panel has significant pre-strain from stamping. The FLD curve is passed as a load curve and the failure strain becomes a function of the minor/major strain ratio.
For a production roof crush model, the recommended combination is *MAT_024 for the flow curve plus *MAT_ADD_DAMAGE_GISSMO for failure, with the FLD option enabled if stamping pre-strain is mapped onto the mesh.
Practical Card Setup
A minimal, working material block for a DP780 roof bow looks like this:
*MAT_PIECEWISE_LINEAR_PLASTICITY
$#  mid        ro         e        pr        sigy      etan      fail      tdel
         1   7.85e-9  210000.0       0.3       480.0       0.0       0.0       0.0
$#    c         p        lcss      lcsr        vp
    4000.0       4.0         1         0       0.0
*DEFINE_CURVE
$#  lcid      sidr      sfa      sfo      offa      offo
         1         0       1.0       1.0       0.0       0.0
$#                abscissa                ordinate
                 0.000                 480.0
                 0.020                 610.0
                 0.060                 720.0
                 0.120                 810.0
                 0.180                 860.0
                 0.300                 900.0
Note that etan is left at zero because hardening is fully defined by LCSS. The fail field is zero because failure is handled by GISSMO. The lcsr field is zero because rate scaling uses Cowper–Symonds.
Verification and Common Pitfalls
Before running the full roof crush model, verify the material card with a single-element tension test. The expected output is a stress–strain response that matches the input curve up to the failure strain, with a yield stress increase of 5–8 % when the strain rate is ramped to 1 s⁻¹. If the element fails prematurely, check that FAIL is not set on the material card when GISSMO is active — the two criteria will compete and the lower one wins.
Common pitfalls in roof crush material modeling include: using engineering stress–strain directly (over-predicts strength by 10–15 %), omitting rate effects (under-predicts peak force by 5–10 %), and using a single failure strain across all element sizes (mesh-dependent results). Each of these can shift the predicted roof strength by more than the 10 % margin typically required for FMVSS 216a compliance.
The diagram above summarizes the complete material modeling chain: coupon data enters on the left, is converted to true stress–plastic strain, feeds the *MAT_024 card, and is augmented by rate scaling and failure criteria before driving the roof crush simulation. The side panel lists the four checks that most often catch errors before they propagate into a non-compliant result.