4. Full frontal rigid barrier impact case s
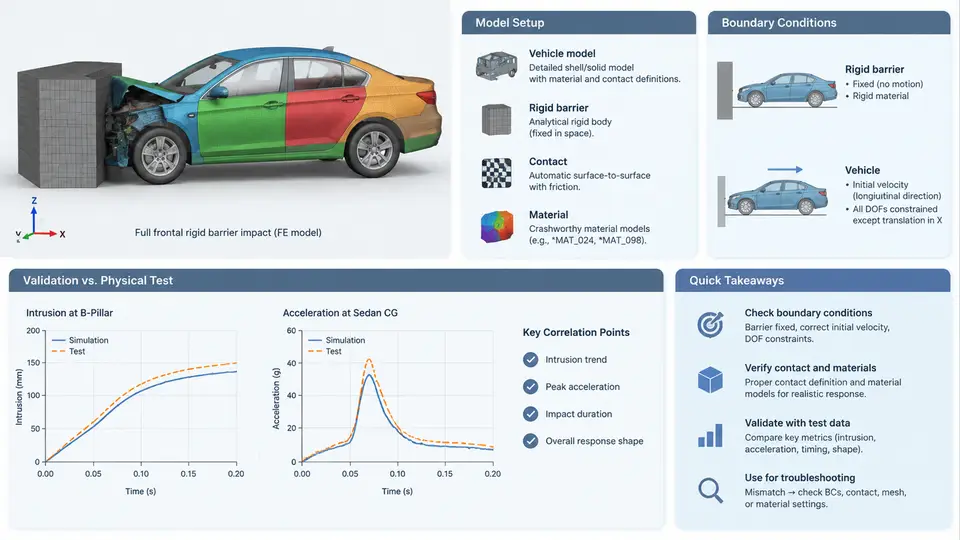
The full frontal rigid barrier test is the anchor case of every crashworthiness program. It is simple to describe — a vehicle travels along a straight line and strikes a fixed, non-deformable wall — yet it exposes the complete load path from bumper beam to rear structure. Because the barrier does not absorb energy, every joule dissipated must come from the vehicle itself, which makes this configuration an excellent first validation target: if the model cannot reproduce a flat rigid-wall impact, it will not reproduce offset or oblique events either.
This chapter builds a complete LS-DYNA model of a passenger car striking a rigid wall at 50 km/h, then compares the predicted response against physical sled and full-vehicle test data. All numeric values below are representative teaching values chosen to illustrate the workflow; they are not measurements from a specific vehicle program.
Coordinate Convention and Unit System
Before any geometry is imported, fix the reference frame. Use a right-handed system with +X pointing forward along the vehicle longitudinal axis, +Y to the driver's left, and +Z upward. The origin sits on ground level at the vehicle centerline, midway between the axles. Acceleration is therefore negative in X during a frontal impact, and the barrier face is a plane at some positive X value. Every keyword, curve, and result plot in this chapter follows this convention; if you switch to a barrier-fixed frame, state it explicitly and re-sign the accelerometer channels.
Adopt the tonne–millimetre–second (t-mm-s) system: mass in tonnes, length in millimetres, time in seconds. In this system, force is in newtons, stress in megapascals, and energy in millijoules. A 1.5 t vehicle becomes 1.5e-3, and a 50 km/h impact speed becomes 13 889 mm/s. Mixing this with the SI system is the single most common source of nonsense results in student models.
Building the Model
The vehicle is assembled from four mesh groups, each with a distinct modelling role:
- Body-in-white (BIW) — shell elements, 5–8 mm characteristic length in the front structure, coarser (15–20 mm) toward the rear. Use
*MAT_PIECEWISE_LINEAR_PLASTICITY(MAT_024) with a mild-steel curve: yield 210 MPa, ultimate 340 MPa at 0.25 plastic strain, failure at 0.35. - Closure and trim masses — doors, hood, decklid, and interior represented as concentrated
*ELEMENT_MASSnodes tied to the BIW with*CONSTRAINED_NODAL_RIGID_BODY. - Powertrain — a rigid block of 180 kg with realistic inertia, connected to the cradle through bushings modelled as
*MAT_SPRING_NONLINEAR_ELASTIC. - Barrier — a rigid wall defined by
*RIGIDWALL_PLANAR, not by solid elements. This avoids contact stiffness tuning and removes barrier deformation from the energy balance.
Spot welds are the weak link in any BIW model. Represent them with *CONSTRAINED_SPOTWELD or, where failure matters, with solid hex weld nuggets using *MAT_SPOTWELD and a force-based rupture criterion. A typical 5 mm nugget in 1.2 mm sheet fails near 4–6 kN in shear; calibrate this against coupon data before trusting any front-end collapse mode.
Boundary Conditions and Contact
The barrier is fully fixed. The vehicle carries an initial velocity via *INITIAL_VELOCITY_GENERATION:
*INITIAL_VELOCITY_GENERATION
$#  nsid      styp        omega        vx        vy        vz
         0         0          0.0  -13889.0       0.0       0.0
$#  xc        yc        zc       nx        ny        nz
     0.0       0.0       0.0       0.0       0.0       0.0
Gravity is applied with *LOAD_BODY_Z at 9810 mm/s² so that suspension preload and tire squash match the static attitude. Without it, the front ride height is wrong and the bumper engages the barrier at the wrong height.
Contact is defined in two layers. A single-surface *CONTACT_AUTOMATIC_SINGLE_SURFACE with SOFT=2 handles self-contact of the collapsing front structure. A separate *CONTACT_AUTOMATIC_SURFACE_TO_SURFACE pairs the vehicle's front surfaces with the rigid wall, using a static friction coefficient of 0.3 and a viscous damping coefficient VDC=20 to suppress high-frequency contact chatter. Set SLSFAC=0.1 initially; if you see penetration in the animation, raise it in steps of 0.05 rather than jumping to 1.0, which adds spurious stiffness.
*HOURGLASS with IHQ=4 (stiffness form) and QM=0.05 for shell-dominated BIW meshes. Check that hourglass energy stays below 5% of internal energy; if it climbs, refine the mesh locally rather than increasing QM.Time Step and Termination
With a 5 mm minimum shell edge and steel properties (E = 210 GPa, ρ = 7.85e-9 t/mm³), the stable time step is approximately 1.0 µs. Add *CONTROL_TIMESTEP with DTINIT=1.0e-6 and TSSFAC=0.9, and enable mass scaling only on the smallest 1% of elements with a target step of 0.8 µs. Terminate at 120 ms with *CONTROL_TERMINATION, which is long enough for the vehicle to rebound and for the rear structure to settle.
Validation Against Physical Test Data
Validation is a sequence of comparisons, not a single pass/fail. Work through them in order, because a failure early in the list invalidates everything downstream.
| Check | Physical test reference | Acceptance band |
|---|---|---|
| Initial kinetic energy | 0.5 × 1500 kg × (13.89 m/s)² = 144.7 kJ | ±2% |
| Peak barrier force | 420–480 kN | ±10% |
| B-pillar acceleration peak | 35–45 g | ±15% |
| Maximum intrusion (toe pan) | 120–160 mm | ±15% |
| Pulse duration to zero velocity | 85–100 ms | ±10 ms |
Filter accelerometer channels with a CFC 60 class filter (SAE J211) before comparing. Raw nodal acceleration contains contact ringing that no physical transducer would record, and comparing unfiltered curves is the most frequent mistake in student validation reports.
When the model disagrees, the failure signature usually points to the cause. A peak force that is too high with correct pulse duration suggests contact stiffness or an over-stiff front rail; check SLSFAC and the shell formulation (use ELFORM=16 for fully integrated shells in the rails). A pulse that is too short with correct peak force indicates premature weld failure — inspect the spotweld force output and compare against the 4–6 kN coupon range. Excessive intrusion with a soft pulse points to missing trim mass or an incorrect material curve beyond yield. Energy balance is the final arbiter: internal energy plus kinetic energy plus sliding interface energy should equal the initial 144.7 kJ within 5% at every time step, and hourglass energy should remain a small fraction of internal energy.
The workflow above is deliberately linear in presentation but iterative in practice. Expect two or three passes: first get the energy balance and pulse duration right, then tune the front-rail material curve and weld strength until peak force and intrusion fall inside the acceptance bands. Only after the rigid-wall case validates should you move to offset deformable barrier or side impact configurations, where the same mesh, contact definitions, and material data carry forward.