1. Frontal impact crashworthiness fundament
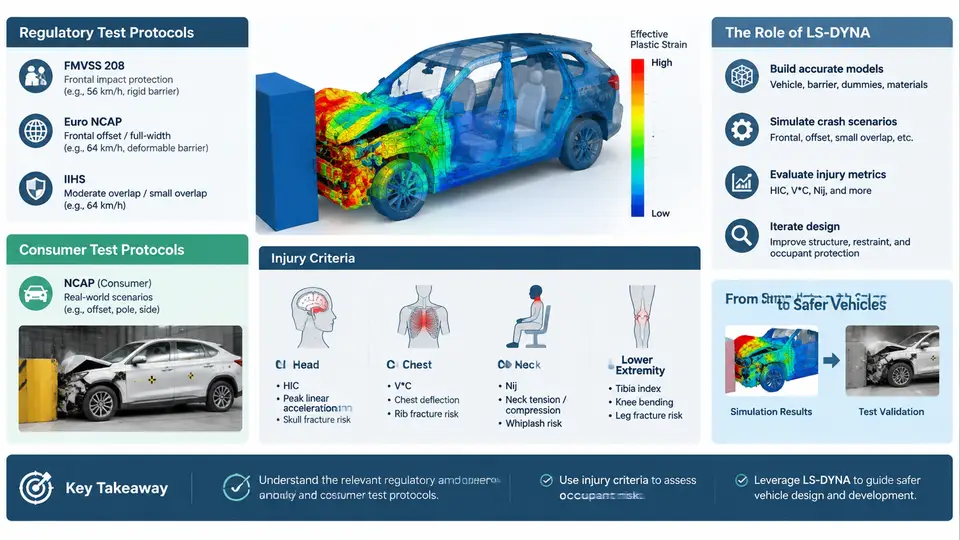
Frontal crashworthiness engineering answers a deceptively simple question: when a vehicle strikes a barrier or another vehicle head-on, can the occupant compartment remain intact while the forces transmitted to the occupants stay below human tolerance limits? Everything in this course — the regulatory tests, the injury criteria, the CAE workflows, the material models — exists to answer that question quantitatively. This chapter establishes the vocabulary and the physical framework that the remaining 29 chapters build upon.
Why Frontal Impact Dominates the Safety Load Case
Frontal collisions account for roughly half of all occupant fatalities in real-world crash statistics, which is why regulators and consumer organizations have invested more test infrastructure in frontal configurations than in any other impact mode. A frontal impact loads the vehicle along its longitudinal axis, and the primary energy-absorbing structure — the front rails, bumper beam, crash boxes, and shotgun — is designed to collapse in a controlled, progressive manner. The engineering challenge is that this collapse must be soft enough to limit deceleration but stiff enough to prevent intrusion into the occupant compartment.
Two quantities govern the entire problem. The first is kinetic energy: at 56 km/h (35 mph), a 1,500 kg vehicle carries approximately 181 kJ. The second is available crush stroke: a typical C-segment vehicle has roughly 600–700 mm of front-end structure ahead of the firewall. The average deceleration required to stop the vehicle within that stroke follows directly from the work-energy theorem:
E_kinetic = 0.5 * m * v^2 = 0.5 * 1500 * (56/3.6)^2 ≈ 181,500 J
F_avg * s = E_kinetic  →  F_avg = 181,500 / 0.65 ≈ 279 kN
a_avg = F_avg / m ≈ 279,000 / 1500 ≈ 186 m/s² ≈ 19 g
Nineteen g is the average deceleration. Real pulses peak far higher — 40 g or more at the occupant compartment — which is precisely why restraint systems, not just structure, determine injury outcome.
Regulatory vs. Consumer Test Protocols
Two families of frontal tests define the design targets. Regulatory tests (FMVSS 208 in the United States, ECE R94/R137 in Europe, GB 11551 in China) are pass/fail mandates: the vehicle must not exceed specified injury thresholds, and non-compliance blocks sale. Consumer tests (Euro NCAP, C-NCAP, IIHS, NHTSA NCAP) go further, producing star ratings and, increasingly, rewarding crash-avoidance technology and compatibility performance.
| Protocol | Configuration | Speed | Key Metric |
|---|---|---|---|
| FMVSS 208 | Full frontal, rigid barrier | 56 km/h | HIC, chest deflection, femur load |
| ECE R94 | 40% offset deformable barrier (ODB) | 56 km/h | HIC, chest compression, knee load |
| Euro NCAP MPDB | 50% offset mobile progressive deformable barrier | 50 km/h | HIC, chest, compatibility rating |
| IIHS moderate overlap | 40% offset deformable barrier | 64 km/h | HIC, chest, lower extremity |
| IIHS small overlap | 25% offset rigid barrier | 64 km/h | Intrusion, HIC, structural rating |
The distinction between full frontal and offset tests matters enormously for structural design. A full frontal test loads both rails symmetrically, so the energy is shared. An offset test loads only one rail, creating a bending moment on the occupant compartment and demanding that the non-struck side carry load through the floor, rocker, and tunnel. Small overlap tests bypass the rails almost entirely, forcing load paths through the wheel, suspension, and hinge pillar — a configuration that exposed widespread structural weaknesses when IIHS introduced it in 2012.
Injury Criteria: Turning Physics into Pass/Fail
Injury criteria convert measured accelerations, forces, and deflections into numbers that correlate with real-world injury risk. The most cited is the Head Injury Criterion (HIC):
HIC = max over [t1,t2] of [ (1/(t2-t1)) * ∫ a(t) dt ]^2.5 * (t2-t1)where a(t) is the resultant head acceleration in g and the integration window is limited to 36 ms (HIC36) or 15 ms (HIC15). The regulatory limit is typically HIC36 ≤ 1000, while Euro NCAP awards full marks below 650. The 2.5 exponent means that short, high-g spikes are penalized heavily — a 100 g pulse lasting 10 ms produces a much higher HIC than a 60 g pulse lasting 30 ms, even though the velocity change is similar.
Other criteria follow the same logic. Chest deflection (typically limited to 50–60 mm for a 50th-percentile male) correlates with rib fracture and internal organ injury. Nij (Normalized Neck Injury Criterion) combines axial force and bending moment to assess neck injury. Femur force is capped at 10 kN to prevent shaft fracture. In LS-DYNA, these are not computed by the solver directly — they are post-processed from accelerometer and load cell outputs using tools like LS-PrePost, HyperGraph, or custom scripts.
The Role of LS-DYNA in Vehicle Safety Development
Physical crash testing costs roughly $50,000–$150,000 per test and consumes a vehicle that takes weeks to build. A full development program might run 50–100 physical tests. LS-DYNA allows engineers to run thousands of virtual tests before the first prototype is built, exploring design variants, material grades, and restraint calibrations that would be impossible to test physically.
The typical CAE workflow for a frontal impact simulation involves several distinct stages. First, the finite element model is assembled: body-in-white, closures, powertrain, suspension, and a validated occupant restraint model (dummy + airbag + belt). Mesh sizes in the front structure are typically 5–8 mm for shell elements, with spot welds represented by either rigid beams or detailed nugget models. Second, boundary conditions are applied: initial velocity of 56 km/h (15.56 m/s) along the X-axis, a rigid barrier wall, and gravity. Third, the contact definitions are set up — single surface contact for self-impacting structure, surface-to-surface for barrier interaction, and tied contacts for welded joints. Fourth, the control cards are configured: termination time (typically 120–150 ms), time step control, and output intervals for d3plot, nodout, and secforc files.
*CONTROL_TERMINATION
$#  endtim    endcyc     dtmin    endeng    endmas
     0.150         0       0.0       0.0       0.0

*CONTROL_TIMESTEP
$#  dtinit    tssfac      isdo    tslimt     dt2ms
       0.0       0.9         0       0.0    -1.0e-6

*INITIAL_VELOCITY
$#     nsid    nsidex     boxid    irigid
         0         0         0         0
$#    vx        vy        vz       vxr       vyr       vzr
  -15560.0       0.0       0.0       0.0       0.0       0.0
Note the negative X velocity: by convention in this course, the vehicle travels in the −X direction toward a barrier at the origin, so the initial velocity is negative. All subsequent references to "longitudinal" or "X-axis" follow this convention unless stated otherwise.
After the run completes, the engineer examines three categories of output. Structural response: intrusion at the firewall, toe pan, and A-pillar; rail collapse mode; and whether the crash boxes folded as intended. Occupant response: head acceleration trace, chest deflection, femur loads, and the resulting HIC/Nij values. Energy balance: the hourglass energy should stay below 5% of total internal energy, and the sliding interface energy should be reasonable — excessive negative sliding energy indicates contact problems.
How the Pieces Fit Together
The diagram below shows the relationship between the physical test configuration, the CAE model, and the injury criteria evaluation chain. It is not a process flow — it is a structural map of how a real-world crash becomes a pass/fail decision.
The feedback loop in the diagram is the heart of the development process. A CAE model that has been validated against at least one physical test — meaning the structural deformation pattern, the occupant acceleration traces, and the energy absorption all match within acceptable tolerances — can then be used to evaluate dozens of design variants. Each variant changes one or more parameters: rail gauge, material grade, trigger bead geometry, airbag vent size, belt load limiter force. The injury criteria are recomputed, and the design space is narrowed until a robust solution emerges.
What Comes Next
This chapter has established the physical problem (kinetic energy vs. crush stroke), the test protocols that define the requirements, the injury criteria that convert physics into pass/fail, and the LS-DYNA workflow that connects them. The chapters that follow will examine each element in detail: material modeling for crash, spot weld and joint failure, occupant restraint simulation, barrier modeling, and the validation process that gives CAE results their credibility. The goal throughout is not just to run simulations, but to make engineering decisions that save lives.