4. Material model calibration for crashwort
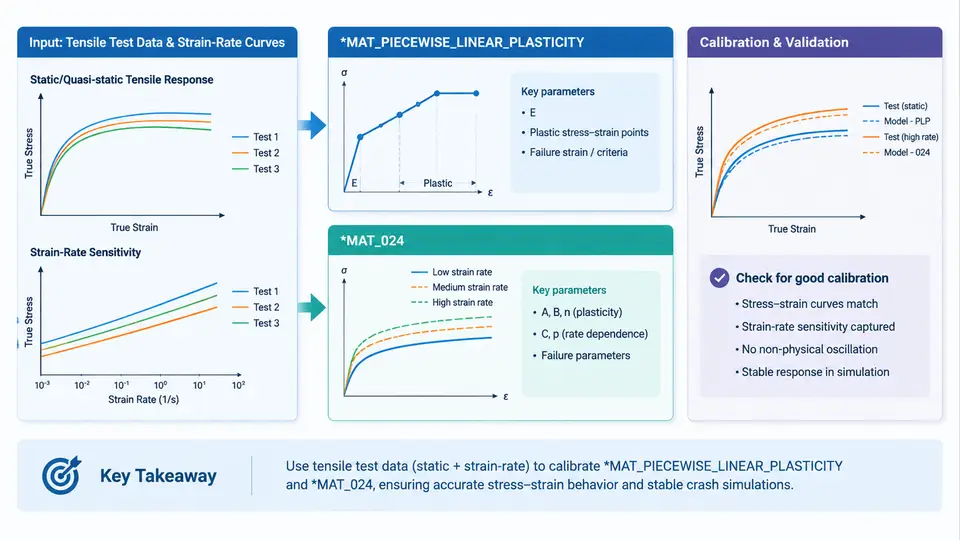
In explicit crashworthiness simulation, the accuracy of the material card frequently dominates the accuracy of the entire model. A perfectly meshed, well-contacted BIW structure will still produce misleading intrusion and energy-absorption predictions if the plasticity definition does not reproduce the true stress–strain response of the sheet steel, aluminium extrusion, or high-strength alloy being crushed. This chapter focuses on the most widely used metal plasticity card in LS-DYNA, *MAT_PIECEWISE_LINEAR_PLASTICITY (material type 24, commonly written *MAT_024), and on the practical workflow for calibrating it from tensile test data and strain-rate curves.
What *MAT_024 Actually Represents
*MAT_024 is an isotropic, elasto-plastic material with a piecewise-linear hardening curve. The card requires density (RO), Young's modulus (E), Poisson's ratio (PR), yield stress (SIGY), and a hardening definition supplied either through the LCSS load curve (effective stress versus effective plastic strain) or through the ETAN tangent modulus. Optional strain-rate dependence is introduced through LCSS combined with the rate-scaling curve LCSR, and failure can be triggered by FAIL (effective plastic strain at failure) or by a minimum time step TDEL.
The critical conceptual point is that the input curve is true stress versus true plastic strain, not engineering stress versus engineering strain. Feeding raw engineering data directly into LCSS is one of the most common calibration errors and typically produces a model that is too stiff at large strains, over-predicting force in axial crush and under-predicting elongation.
Converting Tensile Data to True Stress–True Strain
Start from the raw tensile test record: engineering stress σ_eng = F/A₀ and engineering strain ε_eng = ΔL/L₀. Convert using the standard relations:
σ_true = σ_eng · (1 + ε_eng)
ε_true = ln(1 + ε_eng)
ε_pl   = ε_true − σ_true / E
The elastic portion is removed by subtracting σ_true/E, leaving effective plastic strain. The curve is then truncated at the point of diffuse necking (Considère criterion, where dσ_true/dε_true = σ_true) unless an inverse method or a digital image correlation (DIC) extensometer is used to extend the curve beyond necking. For crash applications, extrapolation beyond necking is often required because local strains in folding hinges routinely exceed uniform elongation. A pragmatic approach is to extend the curve linearly or with a power-law fit up to the failure strain measured from the fracture surface, then cap it with FAIL.
Strain-Rate Scaling with LCSR
Crash events load material at strain rates from 10⁰ to 10³ s⁻¹. *MAT_024 handles this through LCSR, a curve of strain-rate scale factor versus effective strain rate. The scale factor multiplies the quasi-static yield surface. To build LCSR, you need dynamic tensile or split-Hopkinson pressure bar (SHPB) data at several rates — for example 0.001, 1, 100, and 1000 s⁻¹. For each rate, extract the flow stress at a fixed reference plastic strain (commonly 5% or 10%) and divide by the quasi-static value at the same strain. The result is a table of (rate, factor) pairs that LS-DYNA interpolates logarithmically.
LCSR. Treat this as a placeholder and flag it in the model documentation — rate extrapolation is a leading source of force-level error in crash models.Calibration Workflow
The figure below summarises the data flow from raw tensile records to a validated *MAT_024 card, including the feedback loop where a single-element verification exposes curve errors before they propagate into the full vehicle model.
Building the Card: A Worked Example
Consider a 590 MPa dual-phase steel, 1.5 mm thick. Quasi-static tensile data give E = 210 GPa, PR = 0.3, RO = 7.85e-9 tonne/mm³, and an initial yield of 380 MPa. After conversion, the true stress–plastic strain pairs are tabulated and entered as LCSS:
*MAT_PIECEWISE_LINEAR_PLASTICITY
$#   mid        ro         e        pr      sigy      etan      fail      tdel
         1  7.85e-09  210000.0       0.3     380.0       0.0      0.35       0.0
$#    lcss      lcsr        vp
         100       200         0
$#   lcss (effective stress vs effective plastic strain)
        380.0       0.000
        520.0       0.020
        610.0       0.050
        680.0       0.100
        730.0       0.160
        760.0       0.220
$#   lcsr (scale factor vs strain rate)
        0.001       1.000
        1.000       1.080
        100.0       1.220
        1000.0      1.350
Note that ETAN is set to zero because hardening is fully defined by LCSS. Setting both is redundant and can cause confusion during review. The FAIL value of 0.35 is the effective plastic strain at fracture, taken from the post-necking extrapolation and confirmed against the fracture surface reduction in area.
Verification and Common Failure Symptoms
Before committing the card to a full vehicle model, run a single-element or small coupon simulation with prescribed displacement. Compare the reaction force–displacement curve against the tensile test. Typical symptoms and their causes:
- Initial yield too high or too low:
SIGYdoes not match the 0.2% offset proof stress, or the elastic modulus was entered in the wrong unit system. - Hardening slope too steep: engineering stress–strain data were used directly instead of true stress–true plastic strain.
- Force drops prematurely:
FAILis set below the expected failure strain, or element erosion is triggering on a coarse mesh before the material reaches its true ductility. - Rate sensitivity absent:
LCSRis empty or the load curve IDs are swapped withLCSS. - Negative or zero tangent stiffness: the
LCSScurve is non-monotonic or contains duplicate strain values, causing LS-DYNA to issue a negative volume or stiffness warning.
LCSS curve extends beyond the strain range the element can physically accommodate, or that FAIL is inconsistent with the mesh size.Practical Notes on Mesh Sensitivity and Failure
*MAT_024 with a strain-based FAIL criterion is inherently mesh-sensitive. A 5 mm element and a 2 mm element will erode at different global displacements because the effective plastic strain at failure is a local quantity. For crash models where mesh sizes vary across the structure, consider using *MAT_ADD_EROSION with a stress-based or energy-based criterion, or calibrate FAIL separately for each mesh resolution. Document the mesh size alongside the material card — a card calibrated for 5 mm shells should not be silently reused on 2 mm shells without re-verification.
Finally, keep the calibration traceable. Store the raw test data, the conversion spreadsheet, the fitted LCSS/LCSR curves, and the single-element verification plot together. When a full vehicle model later shows a force mismatch in a specific region, the ability to trace back to the material card and its verification evidence is what separates a defensible correlation from a trial-and-error fit.