4. Material characterization for spot welds
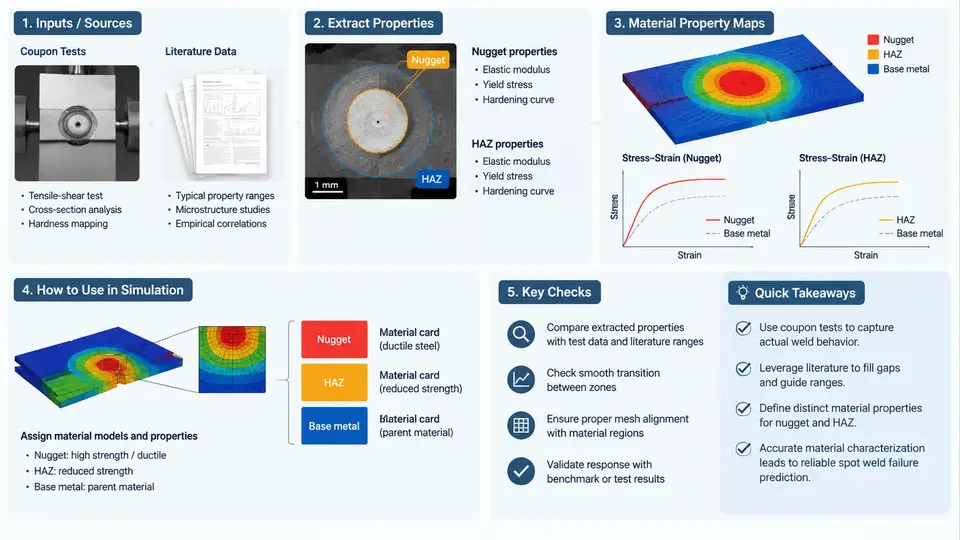
Spot weld failure modeling in LS-DYNA is only as reliable as the material data behind it. A weld model that uses the base-sheet flow curve for the nugget, or that ignores the softened heat-affected zone (HAZ), will typically over-predict joint strength and misplace the failure location. This section explains how to obtain separate mechanical properties for the three metallurgical zones of a resistance spot weld — the fusion zone (nugget), the heat-affected zone, and the base metal — using a combination of coupon testing and published data, and how to convert those measurements into LS-DYNA material cards.
The Three-Zone Structure and Why It Matters
A resistance spot weld is not a homogeneous connection. The rapid heating and cooling cycle of the welding process produces a distinct microstructure in each region:
- Fusion zone (nugget): material that melted and resolidified. It typically exhibits higher hardness and strength than the base metal in steels, but lower ductility.
- Heat-affected zone (HAZ): material that was heated but not melted. In advanced high-strength steels (AHSS), the HAZ often contains a softened sub-zone where tempering reduces local hardness below the base metal — this is frequently the initiation site for pull-out failure.
- Base metal (BM): unaffected parent sheet, characterized by the as-received flow curve.
Because the nugget and HAZ are small (nugget diameters are typically 4–7 mm, HAZ widths 0.5–2 mm), direct tensile testing of isolated zones is impractical. Characterization therefore relies on indirect methods: hardness mapping to infer strength, miniature specimen testing where feasible, and correlation with literature data for similar steel grades and welding parameters.
Hardness Mapping as the Primary Characterization Tool
The most practical and widely used method is Vickers microhardness mapping across a weld cross-section. The procedure is as follows:
- Section the weld through its center, mount, grind, and polish to a mirror finish.
- Etch to reveal the nugget and HAZ boundaries.
- Perform a hardness traverse at 0.1–0.2 mm spacing using a 100–500 gf load, recording HV values from base metal through HAZ into the nugget and out the other side.
- Convert hardness to approximate yield and tensile strength using established correlations.
For steels, a commonly used correlation is σt ≈ 3.3 × HV (in MPa), though the coefficient varies between 3.0 and 3.5 depending on alloy class. This gives a first estimate of the strength ratio between zones. For example, if the base metal reads 180 HV and the nugget reads 420 HV, the nugget tensile strength is roughly 1390 MPa versus 594 MPa for the base metal — a ratio of about 2.3.
Coupon Tests for Base Metal and Joint-Level Calibration
While the base metal flow curve comes from standard tensile coupons, the weld itself is characterized through joint-level coupon tests that exercise the weld under representative loading:
| Coupon Type | Loading Mode | Primary Output | Use in Calibration |
|---|---|---|---|
| Tensile shear (TS) | Shear-dominated | Peak load, displacement at failure | Calibrates shear strength of weld |
| Cross tension (CT) | Normal (peel) | Peak load, energy absorbed | Calibrates normal strength and failure mode |
| Coach peel | Mixed mode | Load-displacement curve | Validates mixed-mode interaction |
| KS-II / lap shear with varying angle | Mixed mode | Failure envelope | Builds mode-dependent failure surface |
These tests do not directly give nugget or HAZ properties. Instead, they provide the system-level response that the weld model must reproduce. The zone properties are then back-calculated by adjusting the nugget and HAZ material cards until the simulated coupon response matches the measured peak load, displacement at peak, and failure mode.
Extracting Zone Properties: A Worked Example
Consider a 1.2 mm DP600 sheet joined by a spot weld with a 6 mm nugget diameter. The base metal tensile test gives a yield strength of 380 MPa and ultimate tensile strength of 620 MPa. Hardness mapping yields:
- Base metal: 190 HV
- HAZ softened zone: 155 HV (minimum)
- Nugget: 410 HV
Using σt ≈ 3.3 × HV, the estimated tensile strengths are 627 MPa (BM), 512 MPa (HAZ), and 1353 MPa (nugget). The HAZ is about 18% softer than the base metal — a classic softening signature in DP steels.
To build LS-DYNA material cards, the base metal curve is taken directly from the tensile test. The nugget and HAZ curves are scaled from the base metal curve using the strength ratios, with the HAZ also adjusted for reduced ductility (failure strain typically reduced by 30–50% relative to base metal). A typical scaling approach:
*MAT_PIECEWISE_LINEAR_PLASTICITY (nugget)
$ MID, RO, E, PR, SIGY, ETAN, FAIL
   101, 7.85e-9, 210000, 0.30, 900.0, 1200.0, 0.08
$ LCSS defines the scaled flow curve
$ Define curve: effective plastic strain vs. stress
$ 0.00   900
$ 0.02  1050
$ 0.05  1250
$ 0.08  1350
The HAZ card uses a lower yield (≈ 420 MPa) and a failure strain of 0.04–0.06. These values are starting points; they must be iterated against coupon test results.
Using Literature Data When Testing Is Not Possible
In early-stage design or when weld coupons are unavailable, literature data can fill the gap. Key sources include:
- Published hardness traverses for the same steel grade and similar welding parameters (electrode force, current, weld time).
- Welding handbook strength ratios: for many AHSS grades, nugget strength is 1.8–2.5× base metal, and HAZ softening can reduce local strength by 10–30%.
- SAE and AWS recommended practices for spot weld testing and property estimation.
When using literature data, always document the source, the steel grade, sheet thickness, and welding schedule. A hardness ratio from a 1.0 mm DP780 weld may not transfer directly to a 1.6 mm DP600 weld. Treat literature values as initial estimates and plan a calibration test if the weld is structurally critical.
From Measurements to Model Inputs: A Summary Workflow
The complete characterization chain can be visualized as a data flow from physical measurements to LS-DYNA material definitions:
The workflow is iterative by nature. A first pass using hardness-derived strengths and scaled flow curves will usually get the peak load within 10–20% of the coupon test. The remaining error is resolved by adjusting the HAZ softening factor and the failure strain of the nugget. In practice, two or three calibration cycles are sufficient for most automotive steels.
Practical Considerations and Common Pitfalls
Strain rate sensitivity. Spot welds in crash-loaded structures experience strain rates of 10–1000 s⁻¹. If the base metal was characterized only at quasi-static rates, the nugget and HAZ curves must also be scaled for rate effects. A common approach is to apply the same rate multiplier to all three zones, though this is an approximation — the nugget, with its martensitic microstructure, may be less rate-sensitive than ferritic base metal.
Sheet thickness effects. The cooling rate during welding depends on sheet thickness, which affects nugget hardness. A hardness map from a 1.0 mm coupon should not be applied directly to a 2.0 mm joint without verification.
Coating and interface effects. Zinc coatings on galvanized steels can introduce porosity or intermetallic phases at the faying surface, reducing effective nugget strength. Hardness mapping may not capture this; joint-level coupon tests are required.
Documentation. Every material card should be traceable to its source — whether a specific coupon test, a hardness map, or a literature reference. In LS-DYNA decks, this is often done through comment lines above the *MAT card. This practice is essential for model review and for updating properties when new test data becomes available.