1. Course overview
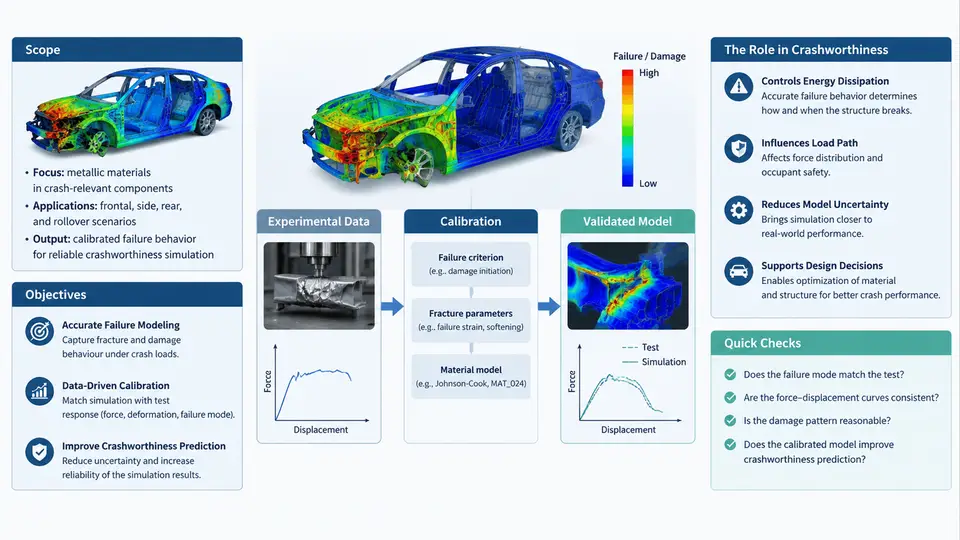
This course addresses one of the most consequential and least forgiving tasks in automotive CAE: calibrating material failure models in LS-DYNA so that crash simulations predict rupture, tearing, and fracture with defensible accuracy. The scope spans the full calibration chain — from specimen-level coupon testing and data reduction, through constitutive and failure model selection, parameter identification, mesh-size regularization, validation against component tests, and finally the governance needed to keep a material card trustworthy across a vehicle program.
The central premise is simple to state and difficult to execute: a crashworthiness model is only as reliable as the failure behavior of its materials. Occupant safety ratings, battery enclosure integrity, fuel system containment, and structural joint performance all depend on whether the simulation predicts where a material tears, when it tears, and how much energy it absorbs before and after the tear initiates. A model that is calibrated only for stiffness and yield strength will often look acceptable in a moderate frontal impact and then fail badly in a pole impact, a side impact with a narrow barrier, or a roof crush — precisely the load cases where failure drives the result.
What "Failure Calibration" Actually Means
Material failure calibration is the process of selecting a failure criterion, identifying its parameters from physical test data, and adjusting those parameters so that the numerical response matches observed fracture behavior across a range of stress states and strain rates. It is not a single curve fit. It is a mapping problem: the failure strain of most automotive metals and composites depends strongly on stress triaxiality, Lode angle parameter, strain rate, temperature, and mesh size. A calibration that ignores any one of these dependencies will produce a model that interpolates well inside its training envelope and extrapolates dangerously outside it.
In LS-DYNA, this mapping is expressed through material models such as *MAT_024 (piecewise linear plasticity) combined with *MAT_ADD_EROSION, the GISSMO damage model (*MAT_ADD_DAMAGE_GISSMO), the Johnson–Cook failure model (*MAT_015 / *MAT_107), the modified Mohr–Coulomb formulation, or the generalized incremental stress-state-dependent damage model. Each carries different assumptions about damage accumulation, regularization, and post-critical softening. Choosing among them is itself a calibration decision, and it must be made before parameter identification begins, because the required test matrix differs.
Why This Matters in Vehicle Development
Consider a realistic development scenario. A body-in-white is being assessed for a 32 km/h side pole impact against a rigid pole with a 254 mm diameter, per the relevant FMVSS or Euro NCAP protocol. The door beam, B-pillar, and rocker are all high-strength steel or aluminum extrusions. If the failure strain of the extrusion is calibrated from a uniaxial tension coupon only, the model will predict failure at a strain level that corresponds to near-uniaxial tension — roughly 0.15 to 0.25 for many advanced high-strength steels. In the actual pole impact, the material near the pole contact experiences bending and shear with stress triaxialities well below the uniaxial value, and the real failure strain may be two to three times higher. The uncalibrated model tears early, under-predicts intrusion resistance, and drives unnecessary design changes. Conversely, a model calibrated only from a plane-strain or shear-dominated test may over-predict ductility in tension-dominated regions and miss a tear that the physical test shows clearly.
The same logic applies to aluminum castings in shock towers, carbon-fiber composite rockers, and magnesium instrument panel beams. Each material class has its own failure phenomenology, and each requires a calibration strategy matched to that phenomenology.
Course Structure and Learning Objectives
By the end of this course, you should be able to:
- Design a coupon test matrix that covers the stress-state and strain-rate envelope relevant to a target crash load case, and justify the coverage quantitatively.
- Reduce raw test data (force–displacement, digital image correlation strain fields) into equivalent plastic strain at failure as a function of triaxiality and Lode parameter.
- Select an appropriate LS-DYNA failure model for a given material class and load case, and defend that selection against alternatives.
- Identify parameters using a combination of direct extraction and inverse optimization, with explicit treatment of mesh-size regularization.
- Validate the calibrated card against component-level tests and diagnose common failure modes of the calibration itself — premature erosion, delayed tearing, mesh-dependent results, and non-physical softening.
- Document and version-control material cards so that a calibration performed for one program can be audited and reused.
The Calibration Workflow at a Glance
The diagram below shows the dependency structure of the calibration process. Note that the arrows are not merely sequential — the feedback path from validation back to test matrix design is where most of the engineering effort actually lives. A calibration that validates poorly usually indicates a gap in the test matrix, not a poor optimizer.
What a Calibrated Card Looks Like in Practice
A finished calibration is not a single number. It is a material card plus a documented envelope. For a typical advanced high-strength steel calibrated with GISSMO, the deliverable includes the plasticity table (LCID for effective stress vs. effective plastic strain at multiple strain rates), the damage initiation curve (LCSDG as equivalent plastic strain vs. triaxiality), the instability curve (ECRIT), the regularization exponent (DMGEXP), the fading exponent (FADEXP), and the mesh-size reference length. Each of these has a physical meaning and a test-data provenance. A card without that provenance is not a calibration — it is a guess with decimal places.
How This Course Approaches the Material
Each chapter combines the underlying mechanics with the specific LS-DYNA keyword implementation. Where a parameter must be extracted from test data, the reduction procedure is shown explicitly — including the equations, the assumptions, and the failure modes of the reduction itself. Where inverse optimization is required, the objective function, the parameter bounds, and the convergence criteria are stated. Where validation is performed, the acceptance criteria are quantitative: force–displacement corridor width, tear initiation location, and intrusion at defined measurement points.
The goal is not to produce a single "correct" card for a given material. The goal is to produce engineers who can build a defensible calibration for any material, document its limits, and recognize when a simulation result is being driven by a failure parameter that was never properly identified. That skill is what separates a crash model that supports design decisions from one that merely produces colorful pictures.