1. Restraint system correlation fundamental
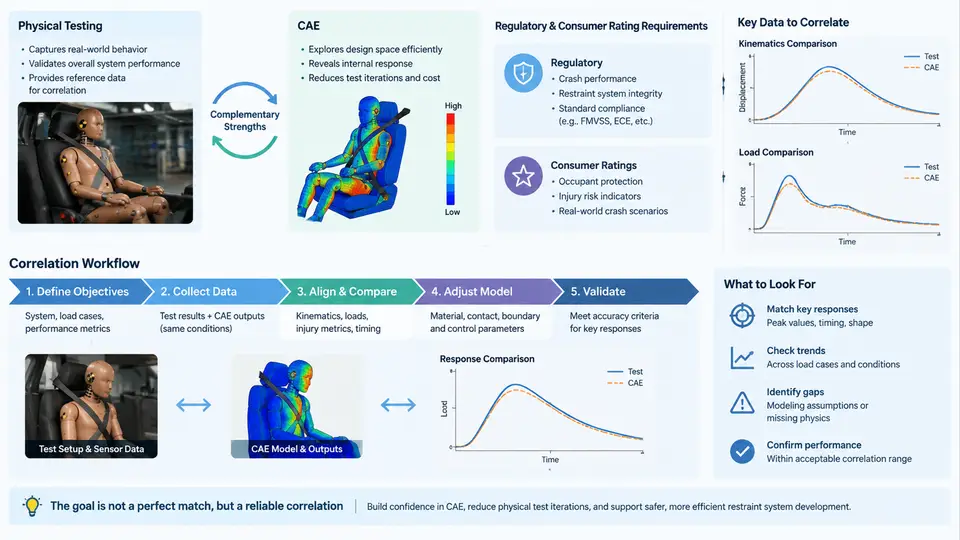
Occupant safety development rests on two complementary pillars: physical testing and CAE simulation. Neither is sufficient alone. A sled test delivers ground-truth acceleration pulses, dummy injury readings, and hardware behavior that no model can fully anticipate; a validated CAE model delivers thousands of parametric evaluations at a fraction of the cost and lead time of a single physical build. Correlation is the disciplined process of making these two worlds agree closely enough that CAE results can be trusted to make engineering decisions — and, ultimately, to support certification and rating outcomes.
This chapter establishes the vocabulary, the regulatory and consumer-rating landscape, and the end-to-end correlation workflow that the remaining chapters will build on.
Why Both Physical Testing and CAE Are Required
Physical testing is the reference reality. A frontal sled test with a Hybrid III 50th-percentile male dummy, a body-in-white buck, and production-intent restraints produces measured head resultant acceleration, chest deflection, femur loads, and belt forces. These measurements are traceable, repeatable within known tolerances, and accepted by regulators. Their limitations are equally real: each test consumes a vehicle buck, a dummy calibration cycle, a sled facility slot, and weeks of scheduling. You cannot economically sweep belt geometry, pretensioner timing, and load-limiter force across dozens of combinations.
CAE — typically explicit finite element analysis in LS-DYNA, PAM-CRASH, or Radioss — provides that sweep capability. A full-vehicle or sled model with a validated dummy model (e.g., LSTC Hybrid III, THOR, or a Euro NCAP-approved Q-series child model) can run overnight on a compute cluster. But a model is only as trustworthy as its correlation status. An uncorrelated model may predict a chest deflection of 42 mm where the physical test measured 51 mm — a difference that flips a pass/fail judgment.
Regulatory Requirements and Consumer Rating Programs
Restraint system performance is judged against two distinct but overlapping frameworks. Regulatory requirements are mandatory: FMVSS 208 (US), ECE R94/R95 (Europe), and equivalent national standards. They define prescribed test conditions — impact speed, barrier type, dummy type, and pass/fail injury criteria such as HIC 15 ≤ 700, chest deflection ≤ 63 mm (for the 50th-percentile male in FMVSS 208), and femur axial force ≤ 10 kN. Compliance is binary: pass or fail.
Consumer rating programs — Euro NCAP, US NCAP, C-NCAP, Latin NCAP, and others — go further. They use more severe or additional load cases (e.g., 64 km/h ODB, 50 km/h MPDB, pole side impact, whiplash, far-side), score performance on a continuous scale, and increasingly require active safety and post-crash considerations. A five-star rating is a market differentiator, not a legal threshold.
| Aspect | Regulatory (e.g., FMVSS 208) | Consumer Rating (e.g., Euro NCAP) |
|---|---|---|
| Nature | Mandatory | Voluntary, market-driven |
| Outcome | Pass / Fail | Star rating (1–5) |
| Load cases | Prescribed frontal, side | Frontal ODB, MPDB, side pole, whiplash, far-side |
| Dummy variants | Hybrid III family | Hybrid III, THOR, Q-series, WorldSID |
| CAE role | Support compliance evidence | Primary development driver; test confirms |
The practical consequence for correlation is that a single model must be valid across multiple load cases, dummy types, and injury criteria. A model correlated only for the 50th-percentile male frontal case is not automatically valid for the 5th-percentile female or for side impact.
The Correlation Workflow
Correlation is not a one-time event; it is a loop that runs throughout vehicle development. The workflow below is the backbone of this course.
- Define the correlation matrix. Identify which physical tests will be used as references, which CAE models will be compared, and which output channels matter (head acceleration, chest deflection, belt force, etc.).
- Build and initialize the CAE model. Assemble the sled or full-vehicle model, position the dummy, route the belt, and apply the measured sled pulse or barrier impact condition.
- Run the simulation and extract channels. Output the same physical quantities at the same locations and with the same filtering (e.g., CFC 600 for head acceleration, CFC 180 for chest deflection) as the test data.
- Compare and quantify. Compute correlation metrics — peak value difference, time-of-peak shift, and curve-level measures such as CORA (Correlation and Analysis) or ISO/TS 18571. A CORA score above 0.8 is a common internal target for a "good" correlation.
- Diagnose and adjust. If correlation is poor, investigate the dominant contributors: belt stiffness, pretensioner timing, load-limiter force, dummy joint friction, contact definitions, or pulse fidelity.
- Re-run and iterate. Repeat until the model meets the acceptance criteria for the intended use.
- Document and freeze. Record the correlation status, the validated range, and any known limitations. This becomes the basis for subsequent CAE-only evaluations.
Visualizing the Correlation Loop
The SVG below shows the correlation workflow as a closed loop, with the key inputs, comparison metrics, and decision points. Note that the loop does not terminate at "model matches test" — it terminates at "model is validated for the intended range of use," which may include extrapolation beyond the tested conditions.
Key Correlation Metrics in Practice
Two curve-level metrics dominate industry practice. CORA (Correlation and Analysis, developed by PDB) combines a corridor rating, a phase rating, and a magnitude rating into a single score between 0 and 1. ISO/TS 18571 provides a standardized alternative with similar intent. Both are sensitive to the filtering applied: comparing an unfiltered simulation channel to a CFC-filtered test channel will produce artificially poor scores. Always apply the same filter class and cutoff frequency to both signals before computing the metric.
Peak value comparison remains the most intuitive check. For a frontal sled test, a typical correlation table might look like this:
| Channel | Test Peak | CAE Peak | Delta | CORA |
|---|---|---|---|---|
| Head resultant accel. (g) | 72.4 | 69.8 | −3.6% | 0.91 |
| Chest deflection (mm) | 48.2 | 51.7 | +7.3% | 0.84 |
| Femur axial force (kN) | 4.1 | 3.8 | −7.3% | 0.88 |
| Belt force — shoulder (kN) | 6.3 | 6.0 | −4.8% | 0.86 |
Note: These values are illustrative examples, not measured results from a specific test.
The chest deflection channel shows the largest delta and the lowest CORA score. In a real correlation exercise, this would trigger a diagnostic investigation: is the belt stiffness correct? Is the load-limiter force set to the production value? Is the dummy chest spring calibrated? Is the contact between the belt and the chest jacket defined with the correct friction coefficient? Each of these can shift chest deflection by several millimeters.
What "Good Correlation" Means for Decision-Making
A model with CORA ≥ 0.8 across all critical channels is generally considered fit for comparative studies — evaluating design alternatives, optimizing parameters, or supporting a test matrix. It is not automatically fit for certification by analysis, which requires a higher bar and explicit regulatory acceptance. The distinction matters: correlation status should always be stated alongside the intended use.
The chapters that follow will walk through each stage of this workflow in detail: building the sled model, matching the pulse, tuning the restraint components, computing correlation metrics, and diagnosing the most common mismatch patterns. The goal is not to achieve a perfect match — that is rarely possible — but to understand where the model is reliable, where it is not, and how to make engineering decisions accordingly.