1. Crash test data acquisition systems
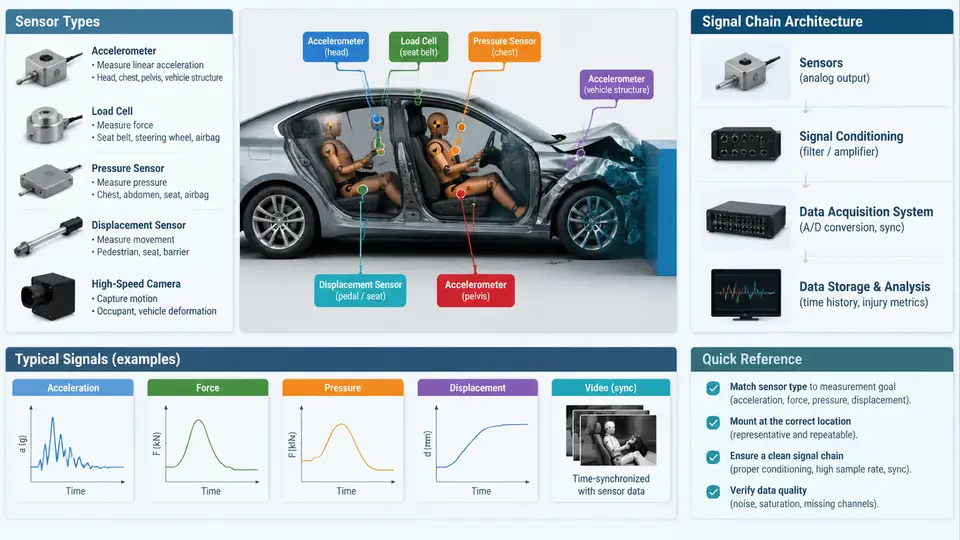
Every injury metric produced after a crash test — HIC, chest deflection, femur load, Nij — is only as trustworthy as the measurement chain that produced it. A crash test data acquisition system (DAS) is therefore not a peripheral accessory but the metrological backbone of the entire test. This chapter establishes the vocabulary and architecture you will rely on for the rest of the course: which sensor families are used, where they are mounted on the vehicle and the ATD (Anthropomorphic Test Device), and how the signal travels from a strained gauge to a validated, time-aligned engineering unit.
Sensor Families Used in Vehicle Crash Testing
Crash test instrumentation divides into four functional families, each with distinct electrical behavior and calibration requirements.
- Accelerometers. Piezoresistive (PR) and variable-capacitance (VC) accelerometers dominate. PR types are preferred for impact work because they tolerate high shock (up to 2000 g) and have DC response, which matters for integrating velocity and displacement. Typical ATD head and chest accelerometers are triaxial, ±500 g full scale; vehicle structure channels may reach ±2000 g.
- Load cells and force transducers. Strain-gauge bridges measure femur axial force, tibia force, neck tension/compression, and seat-belt anchor loads. Full-bridge configurations with 350 Ω gauges are standard, excited at 5–10 VDC.
- Displacement and deflection sensors. Chest deflection in the Hybrid III is measured by a potentiometer-based chest deflection transducer (string pot) or, in THOR, by IR-TRACC optical units. Belt-pull and steering-column displacement use similar string potentiometers.
- Angular rate sensors and tilt sensors. Gyroscopes capture head and pelvis rotation for rotational injury criteria (BrIC, and the rotational components of newer ATD protocols).
Beyond ATD instrumentation, the vehicle itself carries accelerometers on the B-pillar, sill, tunnel, engine block, and rear structure, plus pressure sensors in doors for side-impact work and strain gauges on critical structural members.
Mounting Locations and Their Measurement Intent
Mounting location is dictated by the injury criterion the channel must support, not by convenience. The table below summarizes the standard mapping for a frontal 56 km/h rigid-barrier test.
| Location | Sensor | Primary Use |
|---|---|---|
| ATD head CG | Triaxial accelerometer | HIC15 / HIC36, resultant head acceleration |
| ATD upper & lower chest | Uniaxial accelerometers | Chest g, 3 ms clip, chest deflection correlation |
| ATD chest (sternum-to-spine) | Deflection transducer | Maximum chest compression, AIS probability |
| ATD femur (each leg) | Axial load cell | Femur force, knee-thigh-hip injury risk |
| ATD neck | Load cell + angular rate sensor | Nij, neck moment and shear |
| Vehicle B-pillar (driver side) | Uniaxial accelerometer | Occupant compartment deceleration reference |
| Vehicle sill / rocker | Uniaxial accelerometer | Structural intrusion and pulse shape |
| Seat track / seat frame | Accelerometer + load cell | Seat belt anchorage loads, seat integrity |
Two conventions must be fixed before any channel is wired. First, the SAE J211 sign convention: positive X is forward, positive Y is to the right, positive Z is downward, with rotations following the right-hand rule. Second, the channel polarity of each transducer — a femur load cell in compression must read negative if the criterion expects compression as negative. Mixing these up is the single most common source of post-test rework.
Signal Chain Architecture
The signal chain from transducer to validated data has six stages. Understanding each stage explains why a channel can look "noisy" or "drifting" even when the sensor itself is healthy.
- Transducer. Converts mechanical quantity to an electrical quantity (charge, resistance change, voltage).
- Signal conditioning. Bridge excitation, amplification, and anti-alias filtering. Strain-gauge bridges need excitation and balance; piezoelectric accelerometers need charge amplification.
- Anti-alias filter. A low-pass filter set at or below the Nyquist frequency. SAE J211 specifies Channel Filter Class (CFC) 60, 180, 600, or 1000 depending on the channel — head acceleration uses CFC 1000, chest deflection uses CFC 180.
- Digitization. Sampling at a minimum of 10× the CFC corner frequency; 10 kHz or 20 kHz per channel is common in modern DAS.
- On-board recording. Data stored in the vehicle-mounted DAS, often with a backup umbilical or telemetry link.
- Post-processing. Zeroing, filtering to the specified CFC, time-zero alignment, and unit conversion to engineering units.
Worked Example: Configuring a Frontal Impact Channel Set
Consider a 56 km/h frontal rigid-barrier test with a Hybrid III 50th-percentile male driver. A representative DAS configuration is shown below. These values are illustrative and must be verified against the current SAE J211 and the test protocol in force.
Channel        Sensor              CFC    Sample Rate   Full Scale
HEAD_X         Triaxial accel      1000   20 kHz        ±500 g
HEAD_Y         Triaxial accel      1000   20 kHz        ±500 g
HEAD_Z         Triaxial accel      1000   20 kHz        ±500 g
CHEST_X        Uniaxial accel       180   10 kHz        ±250 g
CHEST_DEFL     String pot           180   10 kHz        0–75 mm
FEMUR_L        Axial load cell      600   10 kHz        ±10 kN
FEMUR_R        Axial load cell      600   10 kHz        ±10 kN
NECK_LOAD      Load cell            600   10 kHz        ±5 kN
NECK_MOM       Load cell            600   10 kHz        ±200 N·m
BPILLAR_X      Uniaxial accel       180   10 kHz        ±500 g
SILL_X         Uniaxial accel       180   10 kHz        ±500 g
Before the test, each channel undergoes a shunt calibration (a known resistor placed across one bridge arm to simulate a known strain) or a known-input calibration for accelerometers. The recorded calibration factor, in engineering units per volt, is applied during post-processing. A channel that fails shunt cal — typically reading outside ±1% of the expected value — must be repaired or replaced before the test proceeds.
Reading the Signal Chain End-to-End
The SVG below traces a single channel — the driver head X accelerometer — from the ATD head CG through conditioning, filtering, digitization, and recording, and shows where the CFC 1000 filter and 20 kHz sample rate sit in the chain. The same topology applies to every other channel, with only the CFC class and full-scale range changing.
Common Failure Modes and How to Recognize Them
Three failure signatures appear repeatedly in crash test data review, and each points to a specific stage of the chain.
- Baseline drift before impact. The channel reads a slowly increasing offset during the pre-test idle period. Cause: thermal drift in the conditioning amplifier or a ground loop. Fix: re-zero immediately before the run and verify the shield is grounded at one end only.
- Clipping at peak. The signal flat-tops at the full-scale limit. Cause: full-scale range set too low for the actual event. Fix: review the expected peak from a similar prior test and select the next higher range; never "fix" clipping by post-hoc scaling.
- High-frequency hash on the trace. Visible oscillation above the CFC corner. Cause: anti-alias filter bypassed or set to the wrong class. Fix: confirm the CFC setting in the DAS configuration file matches the channel's assigned class before the test.
With the sensor families, mounting map, and signal chain established, you now have the framework needed to interpret any crash test channel. The next step in the course is to examine how these raw channels are filtered and validated to the SAE J211 standard before any injury metric is computed.