1. Course overview
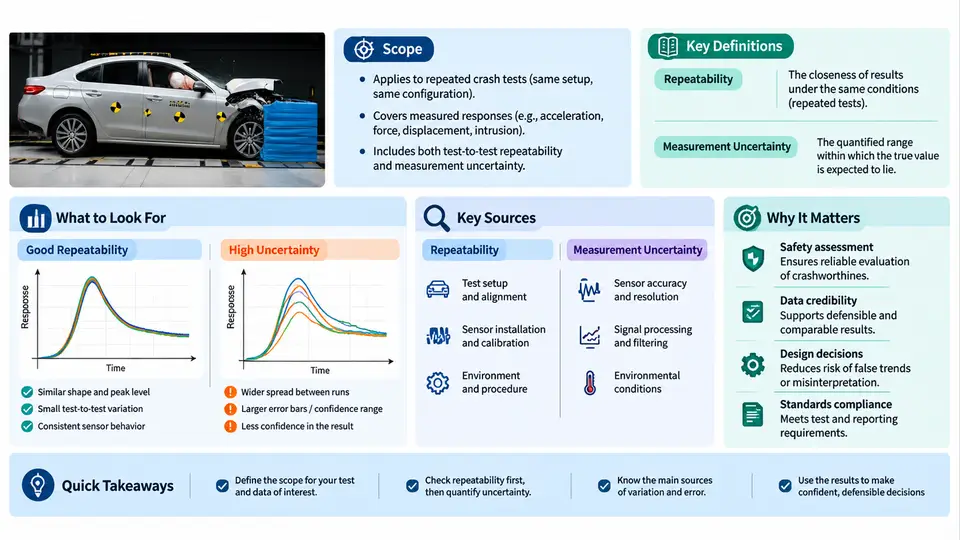
Crash testing is one of the few engineering disciplines in which a single event, lasting roughly 100 to 150 milliseconds, determines whether a vehicle program proceeds, a restraint calibration is accepted, or a regulatory submission is filed. Because that event is destructive and irreversible, the credibility of every conclusion drawn from it rests on two properties that are frequently confused with one another: repeatability and measurement uncertainty. This course treats them as distinct, quantifiable, and jointly necessary conditions for valid crash-test evidence.
Scope of the Course
The material covers the full measurement chain of a full-scale vehicle crash test: the test article and its preparation, the tow and propulsion system, the barrier or deformable element, onboard and offboard instrumentation, data acquisition and filtering, and the post-test analysis that converts raw channels into reported values such as occupant injury criteria. The course addresses frontal rigid-barrier and offset deformable-barrier configurations, side impact, and rear impact as the primary test families, with sled testing used where it isolates a specific source of variation.
Three boundaries define what this course does not cover. First, it is not a regulation text; FMVSS 208, FMVSS 214, UN Regulation No. 94/95, and Euro NCAP protocols are referenced as sources of acceptance criteria, not reproduced. Second, it is not a finite element modeling course, although simulation is discussed where it is used to separate physical variation from numerical variation. Third, it does not treat statistical process control in general; only the estimators and designs that are actually applied to crash-test data are developed.
Key Definitions
Precision in vocabulary is not academic here. Teams routinely disagree about whether a delta-v difference of 1.2 km/h between two tests is a real setup change or ordinary scatter, and that disagreement usually traces back to imprecise definitions.
| Term | Definition | Typical crash-test expression |
|---|---|---|
| Repeatability | Closeness of agreement between results of successive measurements on the same item, under the same conditions, same operator, same equipment, short time interval | Two tests of the same vehicle build on the same sled, same day, same crew |
| Reproducibility | Closeness of agreement between results obtained under changed conditions: different facility, operator, equipment, or time | Same build tested at two contracted facilities |
| Measurement uncertainty | Non-negative parameter characterizing the dispersion of quantity values attributed to a measurand | Expanded uncertainty of chest deflection, e.g. ±2.1 mm at k = 2 |
| Type A evaluation | Uncertainty component obtained from a statistical analysis of repeated observations | Standard deviation of peak head acceleration across n repeat tests |
| Type B evaluation | Uncertainty component obtained from calibration certificates, specifications, or engineering judgment | Accelerometer transverse sensitivity, DAQ gain tolerance, filter corner-frequency tolerance |
| Combined standard uncertainty | Root-sum-square of all Type A and Type B contributions, assuming independence | Combined uc for HIC15 or chest deflection |
| Expanded uncertainty | Combined standard uncertainty multiplied by a coverage factor k | U = k·uc, commonly k = 2 for ~95 % coverage |
Two conventions must be fixed before any number is quoted. First, sign and coordinate conventions: in this course, the vehicle longitudinal axis is x, positive forward in the vehicle reference frame; acceleration channels are reported positive in the direction of the occupant's forward motion during a frontal impact, so a frontal pulse appears as a positive acceleration followed by a negative rebound. Second, filtering convention: all acceleration channels are filtered per SAE J211/1, with channel class CFC 60 for occupant accelerations and CFC 180 or CFC 600 for structural and barrier channels. A peak value quoted without its CFC class is not a defined quantity.
Why Repeatability and Uncertainty Matter in Practice
Consider a realistic decision. A restraint supplier changes a seatbelt load limiter from 3.5 kN to 3.0 kN and runs one confirmation test. Chest deflection drops from 34.2 mm to 31.8 mm, and the acceptance limit is 35 mm. Is the change beneficial, or was the first test simply an outlier?
If historical repeatability data for this test configuration show a standard deviation of 1.6 mm for chest deflection, then the observed 2.4 mm improvement is only 1.5 standard deviations — well within what ordinary scatter can produce. Declaring success would be premature. If instead the historical standard deviation is 0.5 mm, the same 2.4 mm shift is nearly five standard deviations and is very likely a real effect of the load limiter. The engineering conclusion is identical in both cases only if repeatability is unknown; once it is quantified, the two cases lead to opposite decisions.
This is the central argument of the course: a measured difference is only interpretable relative to the uncertainty of the measurement that produced it. Regulatory and consumer protocols implicitly acknowledge this by specifying tolerances — impact speed within +0/−1.1 km/h, barrier alignment within ±25 mm, ambient temperature 21 ± 5 °C — but these tolerances bound the input conditions, not the output dispersion. Two tests can both satisfy every setup tolerance and still differ in HIC by 15 %.
Note the structure of that budget: the largest single contributor is repeat-test scatter, but the Type B terms are not negligible. Reducing only the Type A term by running more repeats would shrink uc from 1.26 mm to about 0.62 mm at best — a factor of two — while the mounting-position term would then dominate. Effective uncertainty reduction requires identifying the dominant contributor, not simply collecting more data.
Sources of Variation Across the Measurement Chain
Variation enters a crash test at every stage, and the diagram below maps the principal contributors along the chain from test article to reported result. It is organized as a signal-and-error chain rather than a procedure, because the engineering question is always where a given contribution enters and how it propagates to the reported value.
The chain makes one point explicit: uncertainty is not a property of the transducer alone. A perfect accelerometer mounted 15 mm from its nominal position, or a correctly calibrated load cell read through a DAQ channel with a 0.5 % gain error, contributes just as much dispersion to the final HIC value. When a lab reports that "the test passed," the defensible statement is that the measured value, together with its expanded uncertainty, lies inside the acceptance limit.
How the Course Is Organized
The remaining chapters build the topic in four movements. Chapters 2 through 8 establish the physical and statistical foundations: the crash pulse, the measurement chain, the difference between accuracy and precision, and the estimators used for repeatability standard deviation. Chapters 9 through 17 develop the uncertainty budget in detail, treating Type A evaluation from repeat tests, Type B evaluation from calibration data, sensitivity coefficients, and the propagation of uncertainty through derived quantities such as HIC15, Nij, and chest deflection. Chapters 18 through 25 address the practical control of variation: test-article build tolerances, tow-speed and alignment control, transducer mounting, DAQ configuration, filtering per SAE J211, and the design of repeat-test programs with adequate statistical power. Chapters 26 through 30 apply the framework to facility qualification, inter-laboratory comparison, regulatory and consumer-test decision rules, and the reporting format that makes uncertainty visible to the reader.
The practical takeaway from this opening chapter is a single habit of mind. Before asking "did the test pass?", ask "how large is the uncertainty of the quantity I am comparing to the limit, and which contributor dominates it?" That question determines whether a result is a decision or merely a data point, and it is the question the rest of this course equips you to answer quantitatively.