1. Pretensioner Force–Time Curve Calibratio
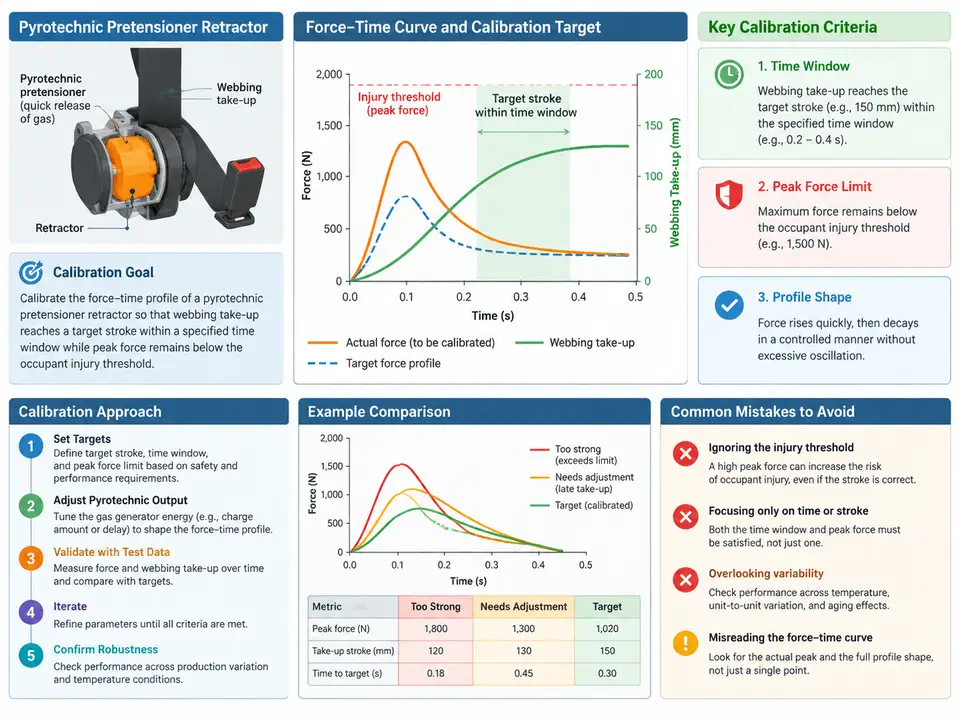
Why the Force–Time Curve Is the Calibration Object
A pyrotechnic pretensioner retractor does not simply "pull the belt." Its useful work is defined by the force–time profile delivered to the webbing after the gas generator fires. Two requirements pull in opposite directions:
- Stroke requirement: the retractor must take up enough webbing (target stroke, e.g. 90–110 mm) inside a defined time window (e.g. 8–18 ms after trigger) so the occupant is coupled to the restraint early in the crash pulse.
- Injury-threshold requirement: the peak force transmitted through the webbing into the occupant must stay below a threshold (e.g. 3.5 kN at the shoulder belt) so the pretensioner itself does not become an injury source.
Calibration therefore means shaping the curve — not just scaling it. A curve that reaches the stroke target too late fails coupling; a curve that reaches it with an excessive early spike fails the injury criterion even if the stroke is correct. The practical calibration levers on a pyrotechnic retractor are the gas-generator output (propellant charge mass and burn rate), the piston/cylinder flow restriction, and the mechanical take-up ratio (spool geometry and clutch engagement). This case fixes the hardware and calibrates the delivered profile against a measured baseline.
Reference Frame and Sign Convention
All forces in this case are tensile webbing force, positive in the take-up direction. Time t = 0 is the electrical trigger to the gas generator. Stroke s(t) is cumulative webbing taken up, positive when webbing is wound onto the spool. The injury threshold is applied to the peak of the filtered force signal (CFC 60 per SAE J211), not to the raw spike, because the occupant response is governed by the filtered load.
Baseline Measurement and the Two Failure Modes
Start from a measured baseline curve from a single retractor on a linear pull test rig with a fixed 50 mm/ms constant-velocity payout, load cell in series with the webbing. A representative baseline (example data, illustrative only) shows:
| Time (ms) | Force (kN) | Stroke (mm) | Observation |
|---|---|---|---|
| 0 | 0.0 | 0 | Trigger |
| 2 | 0.4 | 2 | Gas generator ignition delay |
| 4 | 2.9 | 14 | Early force spike — above threshold |
| 6 | 3.6 | 38 | Peak force, exceeds 3.5 kN limit |
| 10 | 2.1 | 72 | Stroke still short of target |
| 14 | 1.2 | 88 | Approaching target stroke |
| 18 | 0.6 | 96 | Stroke target met, but late |
This baseline exhibits both failure modes simultaneously: an early peak of 3.6 kN (over the 3.5 kN threshold) and a stroke that only reaches 96 mm at 18 ms, at the edge of the window. The calibration task is to flatten the early spike while advancing the stroke — a classic trade-off, because reducing early force normally slows take-up.
Calibration Procedure
- Decompose the curve into three phases: ignition delay (0–2 ms), primary spike (2–7 ms), and sustained take-up (7–18 ms). Each phase maps to a different hardware lever.
- Suppress the primary spike by increasing the initial free volume in the cylinder (a small piston stand-off) or by adding a flow-restricting orifice at the gas inlet. This spreads the first pressure rise over a longer interval, lowering the peak without removing total impulse.
- Recover the stroke by increasing propellant charge mass modestly (e.g. +8%) and, if needed, raising the burn rate so the sustained phase holds pressure longer. Verify that the added charge does not re-inflate the spike.
- Re-measure and iterate on the filtered peak and the time-to-target-stroke. Accept only when both criteria are met with margin.
Worked Example: One Iteration
Apply an orifice restriction that reduces the primary spike by 22% and a charge increase of +8% to extend the sustained phase. The expected (calculated, not measured) result:
| Metric | Baseline | After iteration | Criterion | Pass? |
|---|---|---|---|---|
| Filtered peak force | 3.6 kN | 2.8 kN | ≤ 3.5 kN | Yes |
| Time to 100 mm stroke | ~19 ms | ~15 ms | ≤ 18 ms | Yes |
| Stroke at 18 ms | 96 mm | 108 mm | 90–110 mm | Yes |
| Ignition delay | 2 ms | 2 ms | ≤ 3 ms | Yes |
The iteration meets all four criteria with margin on peak force (0.7 kN) and stroke (2 mm inside the upper bound). The margin on stroke is thin, so a second iteration should confirm robustness across the temperature extremes before sign-off.
Reading the Calibration Map
The diagram below shows how the three hardware levers act on the force–time curve and how the two acceptance criteria bound the acceptable region. It is a parameter-influence map, not a process flow: each lever shifts a specific phase of the curve, and the pass region is the intersection of the peak-force ceiling and the stroke-window floor.
Verification and Failure Symptoms
Accept the calibration only when the filtered peak is at or below 3.5 kN and the stroke reaches 90–110 mm by 18 ms, with the ignition delay under 3 ms. Run at least three units to capture unit-to-unit scatter; a single unit passing is not a calibration.
- Peak still high after restriction: the orifice is too large or the free volume increase is insufficient — the spike is being driven by the initial burn, not by flow. Increase stand-off before adding restriction.
- Stroke late after charge increase: the burn rate is too slow; the added gas arrives after the window. Raise burn rate rather than charge mass.
- Peak re-inflated after charge increase: the added charge is contributing to the primary spike. Re-check the orifice sizing; the two levers interact and must be tuned together.
- Large unit-to-unit scatter: suspect gas-generator lot variation or piston seal friction; this is a hardware issue, not a calibration issue, and should be escalated before further tuning.
Calibration Record (Deliverable)
Record each iteration in a compact table so the tuning history is auditable and the final setting is traceable to a specific hardware configuration:
| Iteration | Orifice (mm) | Charge (mg) | Burn rate | Peak (kN) | Stroke @18 ms (mm) | Result |
|---|---|---|---|---|---|---|
| 0 (baseline) | 3.0 | 420 | nominal | 3.6 | 96 | Fail (peak) |
| 1 | 2.4 | 454 | nominal | 2.8 | 108 | Pass |
| 2 (confirm) | 2.4 | 454 | nominal | — | — | Pending |
The final setting is the iteration-1 configuration, subject to confirmation across three units and the temperature extremes. The record makes clear which lever produced which effect, so a future change to the gas generator or spool geometry can be re-tuned from a known starting point rather than from scratch.