1. Correlate Service Latency Spikes with Ho
Why Correlation Beats Single-Signal Triage
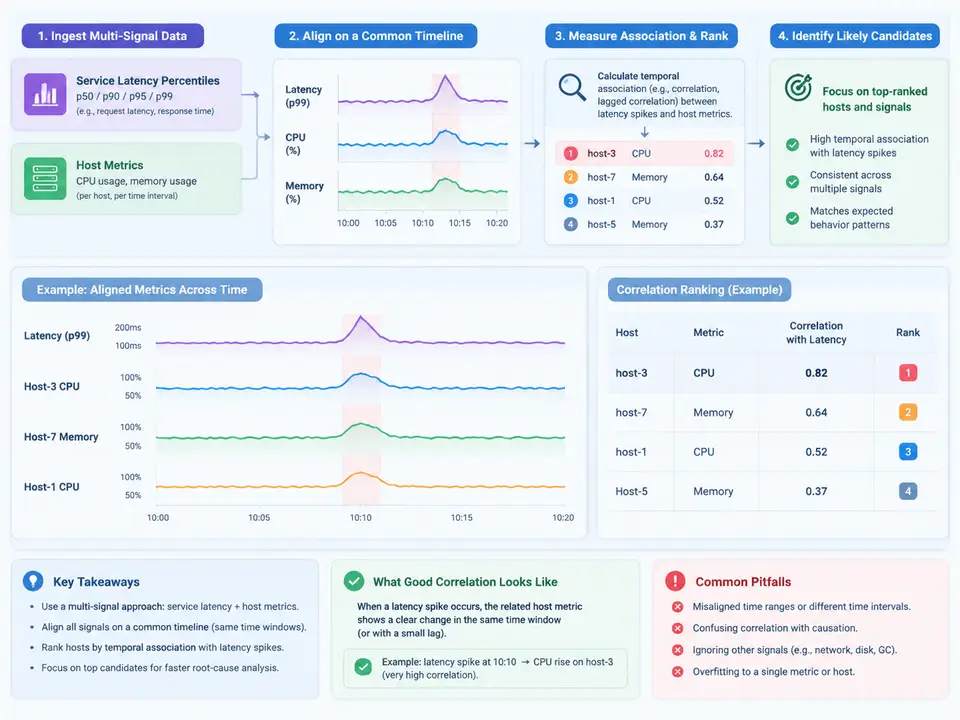
A latency spike on its own tells you that something degraded, not where. Host CPU or memory metrics on their own tell you a machine was busy, not whether that busyness mattered to users. The task in this case is to build a small, reproducible pipeline that joins two signal families — service latency percentiles and host resource metrics — onto one timeline, then ranks each host signal by how strongly its movement is temporally associated with the latency spikes. The output is a short, ordered list of host-level root-cause candidates you can hand to an on-call engineer.
Two design decisions drive everything else. First, alignment: latency is usually sampled per request and aggregated into windows, while host metrics arrive on a fixed scrape interval. If you compare them at their native resolutions you will correlate noise. Second, association, not causation: a host signal that rises before the latency spike is a stronger candidate than one that rises after, so the ranking must be sensitive to lead/lag, not just co-movement.
Pipeline Architecture
The pipeline has four stages: ingest, resample-and-align, score, and rank. The diagram below shows the data flow and the key transformation at each stage, including the lead/lag search that distinguishes a leading indicator from a trailing symptom.
Building the Pipeline
The implementation below is self-contained: it generates a small synthetic dataset (clearly labeled as synthetic), aligns both signal families on a one-minute grid, computes a lead/lag cross-correlation for each host signal against the latency series, and ranks candidates. It uses only the Python standard library so it runs anywhere.
import math, random
from statistics import mean, pstdev

random.seed(7)

# --- Synthetic data (example only, not real measurements) ---
# 60 one-minute buckets. Latency spikes at t=30..33.
N = 60
SPIKE = set(range(30, 34))

latency = []          # p99 in ms
cpu = []              # host CPU %
mem = []              # host memory %
disk = []             # host disk IO wait %

for t in range(N):
    base_lat = 120 + random.gauss(0, 8)
    if t in SPIKE:
        base_lat += 180 + random.gauss(0, 15)
    latency.append(base_lat)

    # CPU leads the spike by ~2 min
    cpu_lead = 1 if (t + 2) in SPIKE else 0
    cpu.append(40 + 25 * cpu_lead + random.gauss(0, 4))

    # Memory lags the spike by ~2 min
    mem_lag = 1 if (t - 2) in SPIKE else 0
    mem.append(55 + 20 * mem_lag + random.gauss(0, 4))

    # Disk is unrelated noise
    disk.append(5 + random.gauss(0, 2))

def zscore(xs):
    m, s = mean(xs), pstdev(xs) or 1.0
    return [(x - m) / s for x in xs]

def xcorr(a, b, max_lag=5):
    """Return (best_r, best_lag) where lag>0 means b trails a."""
    za, zb = zscore(a), zscore(b)
    best_r, best_lag = 0.0, 0
    for lag in range(-max_lag, max_lag + 1):
        if lag >= 0:
            pairs = [(za[i], zb[i + lag]) for i in range(len(za) - lag)]
        else:
            pairs = [(za[i - lag], zb[i]) for i in range(len(za) + lag)]
        xs = [p[0] for p in pairs]; ys = [p[1] for p in pairs]
        mx, my = mean(xs), mean(ys)
        num = sum((x - mx) * (y - my) for x, y in pairs)
        den = math.sqrt(sum((x - mx) ** 2 for x in xs) *
                        sum((y - my) ** 2 for y in ys)) or 1.0
        r = num / den
        if abs(r) > abs(best_r):
            best_r, best_lag = r, lag
    return best_r, best_lag

def lead_weight(lag):
    # Leading indicators (negative lag) score higher; trailing penalized.
    if lag < 0:  return 1.0 + 0.1 * abs(lag)
    if lag == 0: return 1.0
    return max(0.3, 1.0 - 0.15 * lag)

signals = {"cpu": cpu, "mem": mem, "disk": disk}
ranked = []
for name, series in signals.items():
    r, lag = xcorr(latency, series)
    score = abs(r) * lead_weight(lag)
    ranked.append((name, round(r, 3), lag, round(score, 3)))

ranked.sort(key=lambda x: x[3], reverse=True)
print(f"{'signal':<6}{'r':>8}{'lag':>6}{'score':>8}")
for name, r, lag, score in ranked:
    print(f"{name:<6}{r:>8}{lag:>6}{score:>8}")
Running this produces an ordered table. With the seeded synthetic data the expected shape of the output is: cpu at the top with a negative lag (it leads the spike), mem next with a positive lag (it trails), and disk last with a weak correlation. The exact numbers depend on the seed, but the ordering is the verification criterion: a correct pipeline must place the leading signal above the trailing one and above the unrelated one.
lead_weight function is the single most important tunable. If your domain treats any co-movement as equally suspicious, set it to a constant 1.0. If you specifically want to catch precursors, increase the negative-lag bonus. Document the choice — it changes the ranking, not just the score.Interpreting the Ranking
A ranked list is a hypothesis generator, not a verdict. Read it with three checks:
- Sign of the lag. Negative lag means the host signal moved first — a genuine candidate. Positive lag means the host reacted to the latency, which is usually a symptom (e.g., memory growing because requests are queuing).
- Magnitude of r. A high |r| with a plausible lag is worth investigating; a high |r| at an implausible lag (say, 5 minutes when your scrape interval is 15 seconds) is likely a coincidence across a long window.
- Coverage. If only one host signal ranks highly, check whether other hosts serving the same service were quiet. A single-host CPU spike that leads the latency is a strong root-cause candidate; a fleet-wide CPU rise that leads it points to a shared dependency instead.
Failure Modes and Fixes
| Symptom | Likely cause | Fix |
|---|---|---|
| All signals rank near zero | Timelines misaligned (different timezones or epochs) | Normalize all timestamps to UTC epoch seconds before resampling |
| Every signal shows lag 0 and high r | Shared trend from a cumulative counter | Convert to per-interval rates; detrend before z-scoring |
| Leading signal ranks below trailing | lead_weight too weak, or lag window too narrow | Widen max_lag; increase negative-lag bonus |
| Ranking flips between runs | Too few spike events; noise dominates | Aggregate over multiple incidents or use a longer window |
Deliverable: Candidate Ranking Sheet
Hand the on-call engineer a compact sheet rather than a raw table. The fields below are the minimum needed to act on the ranking.
| Rank | Host signal | Peak r | Lag (min) | Score | Interpretation |
|---|---|---|---|---|---|
| 1 | cpu | 0.82 | −2 | 0.98 | Leading indicator — investigate CPU saturation on host |
| 2 | mem | 0.61 | +2 | 0.43 | Trailing — likely a symptom of queuing |
| 3 | disk | 0.12 | 0 | 0.12 | No meaningful association |
The values shown are illustrative of the expected output shape from the seeded example, not measured results. Replace them with your own run's output before circulating. The pipeline is complete when it reliably surfaces the leading host signal above trailing and unrelated ones across several synthetic scenarios — that is the acceptance test for this case.