1. Frontal crash pulse fundamentals
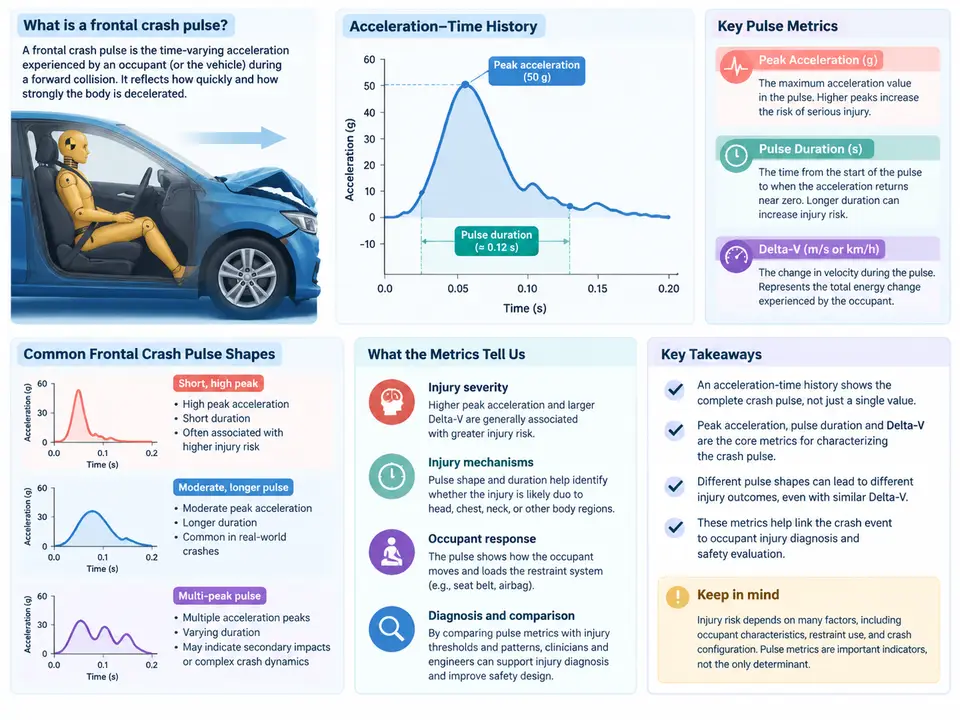
A frontal crash pulse is the acceleration–time history experienced by a vehicle body (or by a specific structural location such as the B-pillar base or the seat track) during a frontal impact. It is the single most important boundary condition in occupant injury diagnosis: the restraint system, seat, and occupant are all driven by this pulse, and the resulting occupant kinematics and injury metrics are largely determined by its shape, amplitude, duration, and timing. Understanding the pulse is therefore the prerequisite for interpreting why a particular occupant sustained a particular injury in a particular crash.
1. Sign Convention and Measurement Reference
Before any pulse can be analyzed, the sign convention must be fixed and held constant throughout the analysis. The standard automotive convention used here is:
- Positive acceleration is directed forward (in the vehicle's direction of travel), i.e., the deceleration of the vehicle during a frontal impact appears as a negative acceleration in the vehicle-fixed frame, or equivalently as a positive value when the pulse is plotted as "deceleration magnitude."
- For clarity in this course, pulses are plotted as deceleration magnitude (positive upward), measured at the vehicle body. This is the convention used by most crash-test data acquisition systems and by the occupant restraint design community.
- The occupant, by contrast, continues forward at approximately the pre-impact velocity until restrained; the relative motion between occupant and vehicle is what generates restraint loading and injury.
Pulses are typically measured with accelerometers mounted on the vehicle structure (e.g., B-pillar base, sill, or tunnel) and filtered per SAE J211 (Channel Frequency Class 60 for vehicle structure, CFC 180 for occupant head, CFC 1000 for some component-level work). The filter class matters: an unfiltered or wrongly filtered pulse can shift peak values by 10–20% and distort the timing of the pulse's characteristic features.
2. Anatomy of a Frontal Crash Pulse
A typical frontal barrier pulse has three recognizable phases:
- Initial rise (0–15 ms): the bumper, crush cans, and front rails begin to deform. The pulse rises steeply. This phase sets the initial occupant–vehicle relative velocity and strongly influences airbag deployment timing.
- Main crush phase (15–60 ms): the primary energy-absorbing structure (rails, shotgun, subframe) crushes. The pulse reaches its peak and holds a plateau or a series of oscillations. This is where most of the vehicle's kinetic energy is dissipated and where the occupant's forward excursion is arrested by the belt and airbag.
- Rebound / secondary phase (60–120 ms): the vehicle decelerates further, may rebound, and the occupant is loaded by the restraint system. Secondary pulses from engine/transmission contact or from the occupant loading the belt can appear here.
3. Key Pulse Metrics
Several scalar metrics are used to characterize a pulse and to correlate it with injury:
| Metric | Definition | Typical frontal range (example) | Diagnostic relevance |
|---|---|---|---|
| Peak deceleration (g) | Maximum filtered deceleration magnitude | 30–60 g (barrier), higher for rigid pole | Drives peak restraint force and head/chest loading |
| Δv (km/h) | Integral of deceleration over the pulse | Equal to closing speed for a fixed barrier | Sets occupant kinetic energy and required restraint stroke |
| Pulse duration (ms) | Time from 5% to 95% of Δv (or similar) | 80–120 ms | Longer duration → lower average force for same Δv |
| Time to peak (ms) | Time from impact to peak deceleration | 20–40 ms | Governs airbag deployment timing window |
| Jerk (g/ms) | Rate of change of deceleration | 1–5 g/ms at initial rise | High jerk → high loading rate on occupant |
| ASIS / pulse shape index | Ratio of peak to average deceleration | 1.5–2.5 | Higher index → more "peaky" pulse, harsher occupant loading |
These metrics are not independent. For a given Δv, a pulse with a higher peak must be shorter (to conserve the integral), and a pulse with a longer duration must have a lower average deceleration. The pulse shape index (peak divided by average) captures how "front-loaded" or "flat" the pulse is, which directly affects how the restraint system must be tuned.
4. From Pulse to Occupant Injury: The Causal Chain
The pulse does not injure the occupant directly; it injures through the restraint system and occupant kinematics. The causal chain is:
Vehicle pulse → relative occupant motion → restraint loading → occupant injury metrics (HIC, chest deflection, femur load, etc.)
Consider a concrete example. A vehicle strikes a rigid barrier at 50 km/h (Δv = 50 km/h ≈ 13.9 m/s). The measured B-pillar pulse has a peak of 45 g at 28 ms and a duration of 95 ms. The occupant, initially at 13.9 m/s relative to the vehicle, moves forward. The seat belt locks and the airbag deploys at approximately 25–30 ms. The occupant's head decelerates against the airbag, producing a head acceleration pulse that is delayed relative to the vehicle pulse by the restraint coupling time (typically 30–50 ms). The chest is loaded by the belt, producing chest deflection that peaks later still.
If the vehicle pulse is too early and too peaky, the airbag may not be fully inflated when the occupant arrives, or the belt may load the chest at a high rate, increasing chest deflection and rib fracture risk. If the pulse is too late and too soft, the occupant may "bottom out" the restraint (exceed available stroke), increasing head excursion and contact with the steering wheel or A-pillar. This is why pulse tuning and restraint tuning are inseparable.
5. Practical Pulse Analysis Workflow
In a real diagnosis, the pulse is not simply "read off" a plot; it must be processed and interpreted. A reproducible workflow is:
- Verify the channel and filter class. Confirm the accelerometer location (e.g., B-pillar base, left/right), the measurement axis, and the SAE J211 filter class applied. Re-filter if the class is inconsistent with the analysis purpose.
- Zero and integrate. Remove pre-trigger offset, then integrate the deceleration to obtain velocity change. Check that the final Δv matches the known closing speed (for a barrier test) within a few percent; a mismatch indicates a filtering or offset error.
- Extract metrics. Compute peak, time-to-peak, duration (5%–95% of Δv), and pulse shape index. Plot the pulse with the occupant response channels (head accel, chest deflection, belt force) on a common time axis.
- Correlate timing. Compare the airbag deployment time, belt lock time, and occupant peak response time against the vehicle pulse features. A head peak occurring before full airbag inflation, or a chest peak coinciding with the pulse's steepest rise, is a diagnostic red flag.
- Compare against the injury outcome. Use the occupant injury metrics (HIC15, chest deflection, femur load) and the observed injury pattern to infer which pulse feature most likely drove the injury. This closes the loop from pulse to injury.
6. Why Pulse Metrics Matter for Injury Diagnosis
The pulse is the "input" to the occupant system, and the injury is the "output." When an injury occurs that is unexpected for the crash severity, the diagnosis almost always involves a mismatch between the pulse and the restraint response. Three classic patterns illustrate this:
- Early, peaky pulse with late airbag: the occupant arrives before the airbag is fully inflated, leading to head contact with the module or steering wheel. The pulse's short time-to-peak is the root cause, not the airbag itself.
- Long, low pulse with insufficient restraint stroke: the occupant's forward excursion exceeds the available belt/airbag stroke, causing contact with the interior. The pulse's long duration and high Δv demand more stroke than the restraint provides.
- High jerk at initial rise: the occupant is loaded abruptly, increasing chest deflection rate and rib fracture risk even when peak deceleration is moderate.
In each case, the pulse metrics (time-to-peak, duration, jerk, shape index) point directly to the mechanism. This is why pulse analysis is the first step in any frontal impact injury diagnosis, and why it must be performed with consistent sign conventions, filter classes, and measurement locations before any restraint or occupant analysis is attempted.