1. Course overview
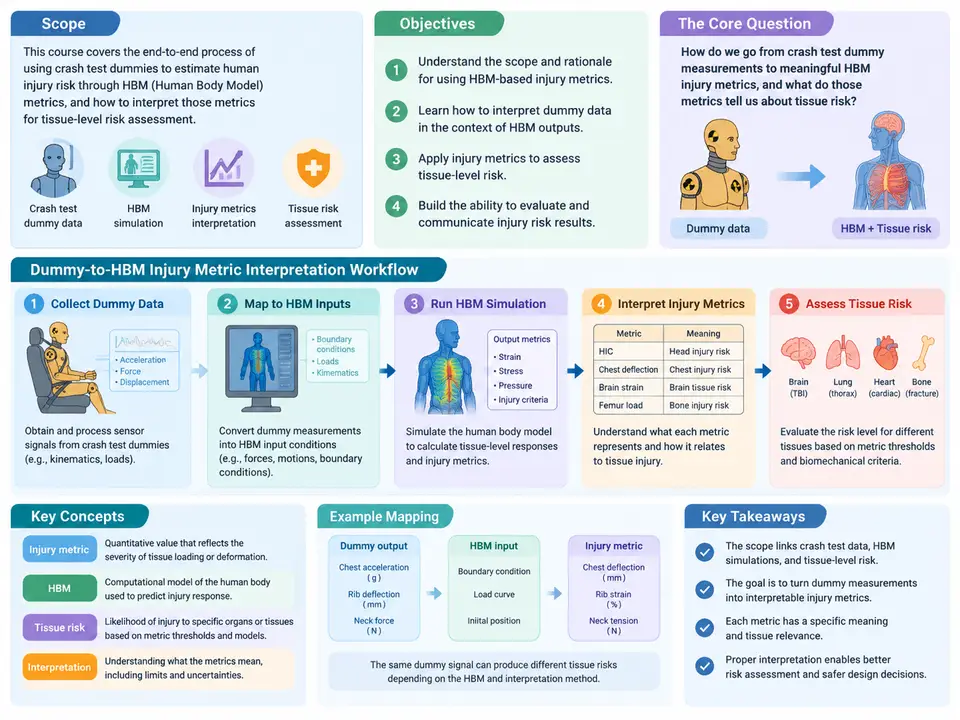
This course addresses a specific and frequently misunderstood problem in occupant safety engineering: how to take the raw injury metrics produced by an anthropomorphic test device (ATD, or "dummy") in a physical crash test and translate them into a defensible assessment of tissue-level injury risk for a human body model (HBM). The two data sources are not interchangeable. A dummy reports a small, fixed set of calibrated channels — head acceleration, chest deflection, femur load, and similar — through transducers whose response is tuned to regulatory corridors. An HBM reports continuous fields: strain, stress, and deformation distributed across thousands of elements representing bone, brain, and soft tissue. Bridging them requires more than a unit conversion; it requires an explicit interpretation workflow that keeps the physical meaning of each metric intact.
The scope of the course is deliberately bounded. We cover the interpretation of dummy injury metrics and their mapping to HBM-predicted tissue response for the primary body regions assessed in frontal and side impact: head and brain, neck, thorax, abdomen, and lower extremities. We do not attempt to validate a specific HBM against a specific dummy, nor do we prescribe a single "correct" injury criterion — the field has several, and the choice depends on the regulatory or research context. Instead, the course builds the reasoning and the procedural discipline needed to make and defend those choices.
What "Interpretation" Actually Means
A dummy injury metric is a scalar summary of a measured physical quantity, normalized against a threshold. The Head Injury Criterion (HIC), for example, is computed from the resultant translational acceleration at the head center of gravity over a defined time window:
HIC = max over t1,t2 of [ (t2 - t1) * ( (1/(t2-t1)) * ∫ a(t) dt )^2.5 ]
      subject to t2 - t1 ≤ 15 ms
      a(t) in g, time in seconds
The number that comes out — say HIC = 680 — is not itself an injury. It is a position on an empirically derived risk curve, typically the Versonda or similar probability-of-injury function, that maps HIC to a likelihood of a specified severity level (e.g., AIS 3+ head injury). Interpretation therefore has three layers: computing the metric correctly from the channel data, locating it on the appropriate risk curve, and reconciling that risk statement with what the HBM predicts at the tissue level. Most errors in practice occur in the second and third layers, not the first.
The same logic applies to chest deflection (a normalized deflection percentage against a risk curve for rib fracture), to Nij for the neck (combined axial load and bending moment against a tension/compression-bending interaction diagram), and to femur force against a fracture threshold. Each metric carries its own normalization convention, its own time window, and its own risk function. Mixing conventions — for instance, applying a 15 ms HIC window to a metric defined over 36 ms — silently corrupts the result.
Objectives
By the end of this course, a learner should be able to:
- Extract and verify dummy channel data, confirm sampling and filtering conventions, and compute the standard injury metrics with correct time windows and normalization.
- Select the appropriate risk curve for a given metric, severity level, and population, and state the resulting injury probability with its uncertainty.
- Map each dummy metric to the corresponding HBM output region and quantity, and explain why the mapping is approximate rather than exact.
- Identify and quantify the dominant sources of discrepancy between dummy-derived risk and HBM-predicted tissue response.
- Produce a traceable interpretation record that a reviewer or regulator can audit.
The Interpretation Workflow
The workflow below is the backbone of the course. It is a sequence of decisions, not a fixed software pipeline, and the order matters because each stage constrains the next.
Stage 1 is data hygiene. Before any metric is computed, confirm the sampling rate (typically 10 kHz or higher for acceleration channels), the anti-alias filter class (SAE J211 CFC 1000 for most occupant channels, CFC 600 for some chest channels), and the sign convention. A common failure is a channel recorded with an inverted polarity or a filter applied twice; the resulting HIC can be off by 15–20% with no visible symptom in the time history. Stage 2 computes the metric with the correct window — HIC over 15 ms, Nij over the full impact duration, chest deflection as a percentage of half-chest depth. Stage 3 places the metric on a risk curve and states the probability explicitly, along with the population the curve was derived from (e.g., mid-size male, 50th percentile). Stage 4 maps the metric to the HBM: HIC maps to brain strain or skull stress in a defined region; chest deflection maps to rib strain; Nij maps to cervical spine load. Stage 5 reconciles the two and, critically, feeds back — a mismatch at Stage 5 often means the mapping at Stage 4 was wrong, not that the dummy or the HBM is wrong.
Why the Workflow Is Not a Straight Line
The dashed feedback paths in the figure are the part most practitioners skip. Suppose a frontal test yields HIC = 720, which on a typical risk curve corresponds to roughly a 10–15% probability of AIS 3+ head injury. The HBM, run with the same pulse, predicts a peak maximum principal strain in the corpus callosum of 0.18. If the strain-based risk curve for that tissue suggests a substantially different probability, the discrepancy is informative: it may indicate that the dummy's rigid head does not reproduce the rotational component that drives brain strain, or that the HBM's material properties are not calibrated for the loading rate. The correct response is to revisit Stage 4 — confirm the region, the element set, and the time alignment — and only then to question the risk curve at Stage 3. Treating the workflow as a one-way pipeline hides exactly the information the exercise is meant to produce.
How the Course Is Organized
The chapters that follow move through the workflow in order but return to it repeatedly. Early chapters establish the metric definitions and the computation discipline (Stages 1–2). The middle chapters build the risk-curve selection and the HBM mapping for each body region (Stages 3–4), with worked examples using representative channel data and clearly labeled assumed parameters. Later chapters address reconciliation, uncertainty, and the interpretation record (Stage 5), including how to document a discrepancy that cannot be resolved. Throughout, examples use illustrative values — a HIC of 680, a chest deflection of 32%, a Nij of 0.85 — that are chosen to exercise the reasoning, not to represent any specific test. Where a calculation is shown, the inputs and the arithmetic are given so the reader can reproduce it; where a result is stated, it is identified as an assumed or illustrative outcome rather than a measured one.
The intended outcome is not memorization of thresholds. It is the ability to look at a dummy channel, a computed metric, and an HBM field, and to construct a coherent, auditable statement of what the occupant's tissue-level injury risk most likely is — and to know, and say, where that statement is uncertain.