1. Crash injury prediction fundamentals
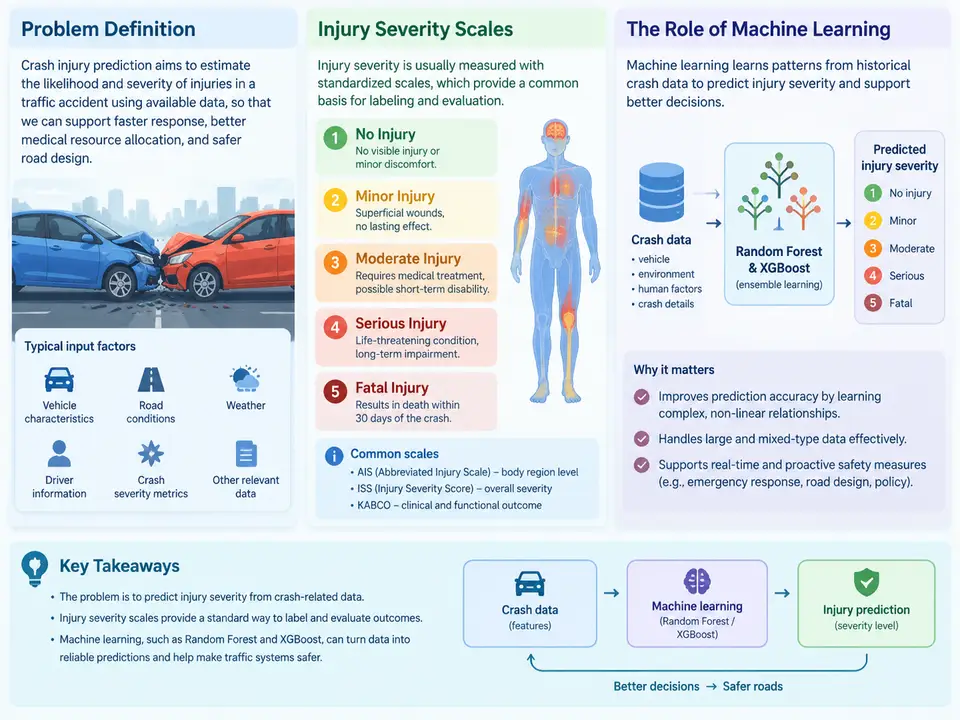
Crash injury prediction is the task of estimating how severe the injuries resulting from a vehicle collision are likely to be, given information about the crash, the vehicles involved, the occupants, and the environment. In traffic safety engineering, this is not an academic exercise: the output feeds into occupant protection design, emergency medical response prioritization, insurance risk rating, and the evaluation of countermeasures such as intersection redesign or speed-limit changes. Before any random forest or XGBoost model can be trained, the analyst must settle three foundational questions — what exactly is being predicted, how injury severity is encoded, and where machine learning fits relative to classical statistical approaches.
Defining the prediction problem
A crash injury prediction problem is formally a supervised learning task. Each record describes one crash (or one occupant within a crash), and the target variable is an injury severity outcome. The features fall into several natural groups:
- Crash characteristics — collision type (head-on, rear-end, angle, rollover), impact speed or speed limit, time of day, road class, weather and surface condition.
- Vehicle attributes — body type, model year, curb weight, presence of airbags and electronic stability control.
- Occupant attributes — seating position, age, sex, restraint use (belted/unbelted), ejection status.
- Environmental and geometric factors — rural versus urban, junction control, lighting, horizontal curvature.
The critical design decision is the unit of analysis. Predicting at the crash level (was anyone killed?) answers a different question from predicting at the occupant level (was this specific belted driver seriously injured?). Occupant-level models generally perform better because they preserve restraint and seating information that gets averaged away at the crash level. A second decision is whether to treat severity as an ordinal target or collapse it into a binary outcome. Binary models are easier to interpret and to evaluate with a single threshold, but they discard the ordering information that ordinal severity scales deliberately encode.
Injury severity scales
Injury severity is almost always recorded on an established scale rather than invented ad hoc. The most widely used are:
| Scale | Levels | Typical use |
|---|---|---|
| KABCO (police-reported) | K fatal, A suspected serious, B suspected minor, C possible, O property damage only | National crash databases; coarse but universally available |
| MAIS (Maximum Abbreviated Injury Scale) | 1 minor … 6 maximal, 9 unknown | Detailed trauma registries; clinical severity |
| ISS (Injury Severity Score) | 0–75, derived from three body regions | Polytrauma outcome studies |
KABCO is the workhorse of large-scale crash analysis because it is attached to essentially every police crash report. Its weakness is subjectivity: "suspected serious" is an officer's judgment, not a clinical diagnosis, and studies consistently find misclassification between adjacent levels. MAIS is clinically grounded but requires linkage to hospital or trauma records, which sharply reduces sample size. A common practical compromise is to define the target as KA (fatal or serious injury) versus BC O (minor, possible, or none), which aligns with the serious-injury reduction targets used in many national road safety strategies.
Why machine learning, and where it fits
Classical crash severity models — ordered probit, logit, and their variants — assume a specific functional form linking features to the latent severity propensity. They are interpretable and statistically well understood, but they struggle with high-order interactions: the effect of speed on injury risk depends jointly on restraint use, vehicle mass, and collision type, and a linear-in-parameters specification captures this only if the analyst hand-crafts interaction terms. Tree-based ensembles such as random forest and XGBoost learn these interactions directly from data, handle mixed categorical and continuous predictors without dummy-variable explosion, and are robust to outliers and irrelevant features.
The trade-off is transparency. A gradient-boosted model with hundreds of trees is not a coefficient table, so interpretation shifts to feature importance, partial dependence, and SHAP values. In a safety-engineering context this matters: a model that says "speed limit and belt use dominate" is actionable, while an opaque score is not. The practical stance is to use ensembles for predictive accuracy and post-hoc explanation tools for insight, and to keep a simpler baseline model for sanity checking.
Two data realities shape every crash-injury project. First, severe outcomes are rare — fatal crashes are a small fraction of all reported crashes — so the target is heavily imbalanced and accuracy is a misleading metric. Second, crash databases contain missing and inconsistently coded fields, particularly for occupant-level variables. Both issues are handled downstream, but they must be anticipated at the problem-definition stage, because they determine whether the target should be binary or ordinal and whether the unit of analysis should be the crash or the occupant.
A worked framing example
Consider a state crash database with 120,000 police-reported crashes over five years, of which 3,400 are coded K or A. The analyst decides on occupant-level analysis, yielding roughly 180,000 occupant records, and defines the target as KA versus BCO. A minimal reproducible framing looks like this:
target   = 1 if KABCO in {K, A} else 0
features = [collision_type, speed_limit, vehicle_body, model_year,
            occupant_age, sex, restraint_used, seating_position,
            road_class, lighting, weather, rural_urban]
split    = stratified 70/15/15 train/validation/test
metric   = PR-AUC and recall at fixed precision (e.g. 0.80)
baseline = ordered probit on the same features
Note what this framing fixes before any model is trained: the unit of analysis, the severity mapping, the feature set, the split strategy (stratified to preserve the rare class), and the evaluation metric (PR-AUC rather than accuracy, because a model that predicts "no serious injury" for every record would score above 95% accuracy while being useless). The ordered probit baseline is not decoration — if the ensemble cannot beat it on PR-AUC, the added complexity is not justified.
What the first chapter establishes
The foundations laid here determine everything downstream. The unit of analysis controls which features are available; the severity scale controls the label distribution and the choice of loss function; the imbalance and missing-data realities control the resampling and imputation strategy; and the baseline model controls whether the ensemble's complexity is earned. Random forest and XGBoost are powerful precisely because they absorb interaction structure that classical models require the analyst to specify — but they inherit every ambiguity in the problem definition. Getting the definition, the scale, and the evaluation metric right is the difference between a model that supports safety decisions and one that merely produces plausible-looking numbers.