1. Airbag deployment physics
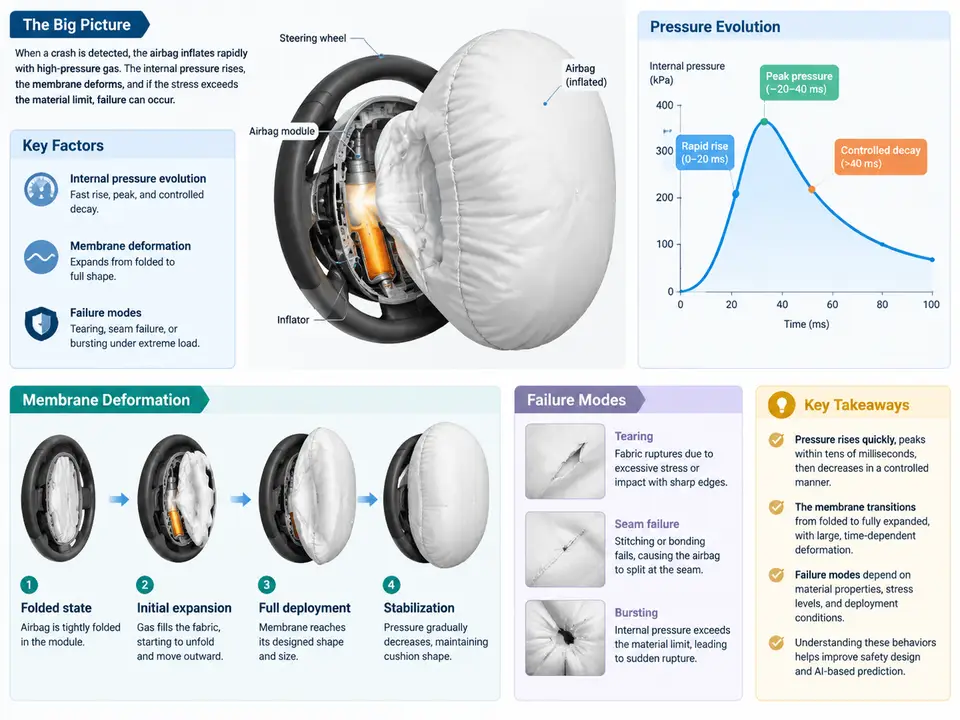
An airbag is a gas-driven membrane structure that must inflate, absorb occupant energy, and vent in a controlled sequence measured in tens of milliseconds. Before any AI model can predict pressure or deformation fields, we need a clear physical picture of what actually happens inside the cushion. This chapter establishes that baseline: how the inflator delivers gas, how internal pressure evolves through the deployment phases, how the fabric membrane deforms and loads its seams, and which failure modes dominate in real restraint systems.
The inflation chain: from pyrotechnic charge to cushion pressure
A typical driver frontal airbag uses a pyrotechnic inflator. When the crash sensor fires, the initiator ignites a propellant grain; combustion generates gas at high temperature (roughly 1000–2000 K at the combustion zone) and high pressure inside the inflator housing. The gas passes through a filter and cooling screen, then exits through nozzle ports into the cushion. The cushion itself is a folded fabric envelope, so the first few milliseconds are dominated by unfolding rather than by pressure rise: the gas must open the folded geometry before a meaningful internal volume exists.
Two quantities govern the early phase. The mass flow rate from the inflator, ṁ(t), is set by the combustion profile and nozzle area; the cushion volume, V(t), is set by how fast the fabric unfolds. Internal pressure follows from a mass and energy balance on the cushion control volume:
dP/dt = (γ R T / V) · ṁ − γ P · (dV/dt) / V − (γ − 1)/V · Q̇_losswhere γ is the ratio of specific heats of the gas mixture, R the gas constant, T the gas temperature, and Q̇_loss the heat lost to the fabric and to the vent. The practical reading of this equation is important: pressure rises when gas mass enters faster than volume grows, and pressure collapses when the cushion expands rapidly (large dV/dt) or when venting opens. This is why measured pressure curves are not monotonic ramps — they show a steep initial rise, a plateau or dip during unfolding, a second rise as the occupant loads the cushion, and a decay as gas vents.
Deployment phases and pressure evolution
Engineers usually divide deployment into four overlapping phases, each with a distinct pressure signature:
- Initiation and breakout (0–5 ms): the inflator fires, the module cover splits along its tear seam, and the folded cushion begins to emerge. Cushion volume is small, so pressure can spike briefly inside the inflator and the first cushion folds.
- Unfolding and free expansion (5–20 ms): the cushion extends toward the occupant. Volume grows faster than gas can be supplied, so internal pressure is relatively low and the membrane is in a nearly unloaded, wrinkle-dominated state.
- Occupant interaction (20–50 ms): the occupant contacts the cushion. The cushion volume is now constrained by the occupant's body, dV/dt drops, and pressure rises sharply — this is the energy-absorbing phase.
- Venting and deflation (50–150 ms): gas escapes through vent holes or porous fabric, pressure decays, and the cushion softens to let the occupant settle back.
For a driver airbag, peak cushion pressure during occupant loading is typically in the range of 1.5–2.5 bar absolute for a 50th-percentile male at a 50 km/h barrier test, but this is strongly dependent on inflator output, cushion volume, vent area, and ambient temperature. Cold deployment (−35 °C) reduces propellant burn rate and gas temperature, lowering peak pressure; hot deployment (+85 °C) raises it. Any predictive model must therefore treat temperature as a first-class input, not a nuisance parameter.
Membrane deformation: wrinkles, biaxial tension, and seam loading
The cushion is not a balloon. It is a sewn or woven envelope with a defined flat pattern, and its deformation is governed by the fabric's orthotropic stiffness, the seam construction, and the venting strategy. During unfolding, the membrane is largely in a low-tension, wrinkle-dominated state: the fabric buckles where the local curvature is negative, and the pressure field is nearly uniform because the gas has not yet been constrained. This is the regime where fold pattern and module packaging dominate the outcome, and where a predictive model must resolve the folded geometry rather than treat the cushion as a smooth shell.
Once the occupant contacts the cushion, the membrane transitions to biaxial tension. The stress state is approximately plane stress with two principal membrane resultants, N₁ and N₂, related to the local curvature radii R₁ and R₂ and the pressure P by the membrane equilibrium (Laplace) relation:
N₁/R₁ + N₂/R₂ = PFor a cushion pressed against a flat occupant chest, one curvature radius becomes very large, so the membrane resultants concentrate along the seam and the cushion periphery. This is why seam peel strength and the seam allowance are critical design variables: the seam carries the highest membrane load, and a seam that is adequate in a static burst test can still fail under the dynamic, non-uniform loading of a real deployment.
Vent design closes the loop. A larger vent area lowers peak pressure and softens the occupant interaction, but it also reduces the energy absorbed per unit of cushion volume and can allow the occupant to "bottom out" against the module. The vent is therefore a tuning parameter that trades peak pressure against stroke, and its effect is visible directly in the pressure curve as a steeper decay after the loading peak.
Failure modes and their signatures
In restraint systems, failures are rarely random; each mode leaves a recognizable signature in the pressure trace, the post-test cushion, or both. The table below summarizes the dominant modes and how to recognize them.
| Failure mode | Physical mechanism | Pressure signature | Post-test evidence |
|---|---|---|---|
| Seam rupture | Peel or shear overload at the seam under biaxial tension | Abrupt pressure drop during loading phase | Torn seam, frayed thread, cushion split along seam line |
| Fabric burst | Local stress concentration exceeds weave strength | Sharp spike then collapse | Hole or tear away from seam, often near a fold crease |
| Incomplete deployment | Insufficient gas mass or blocked unfolding | Low, flat pressure plateau; no loading peak | Cushion partially folded, module cover not fully split |
| Over-pressure | Excess propellant or blocked vent | Peak well above nominal, slow decay | Stretched fabric, elongated vent, seam distortion |
| Vent blockage | Fabric or debris occludes vent hole | Elevated plateau, delayed decay | Vent covered by folded fabric, scorching near vent |
| Module cover failure | Tear seam does not open cleanly | Delayed pressure rise, erratic early trace | Cover fragment retained, asymmetric cushion emergence |
What this means for prediction
The physics above defines the input space and the target space for any AI model in this course. Inputs include inflator mass flow profile, ambient temperature, cushion flat pattern and fold sequence, fabric orthotropic properties, seam construction, vent area, and occupant position. Targets include the internal pressure history P(t) and the membrane deformation field — typically principal stretch or membrane resultant over the cushion surface and over time. The failure modes tell us which regions of the output space matter most: seam-adjacent stress, vent-adjacent pressure gradients, and the fold creases where fabric burst initiates. A model that predicts a smooth pressure curve but misses the seam-localized stress peak is not useful for design, which is why the next chapters build the dataset and architecture around these physically motivated quantities rather than around generic image regression.