1. Define Credibility Requirements for a Re
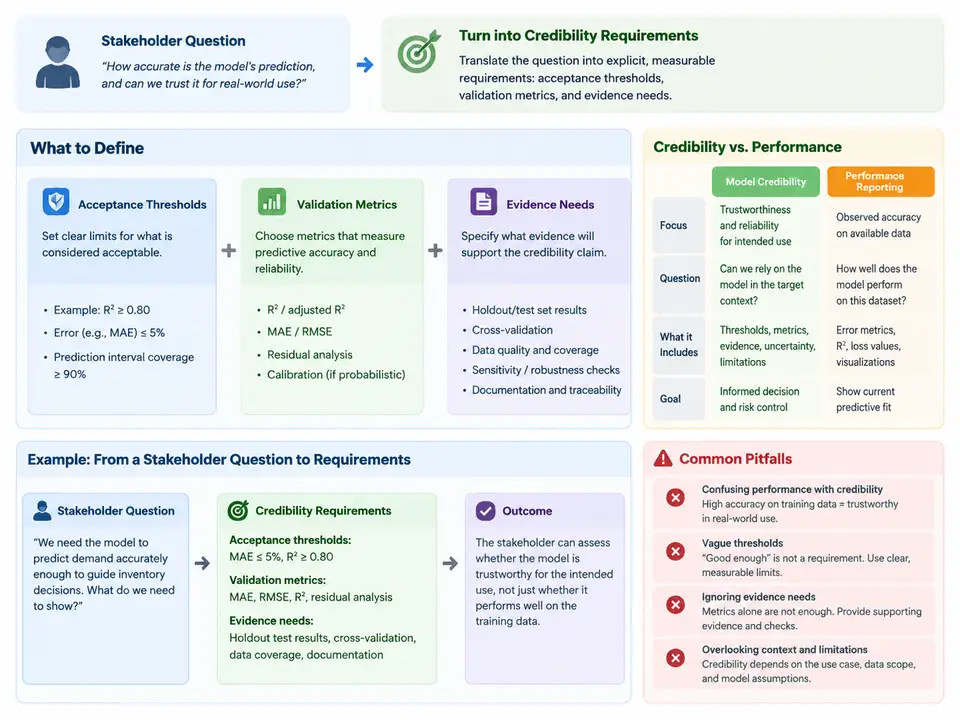
From a Stakeholder Question to a Credibility Requirement
A stakeholder rarely asks for "a credible model." They ask something concrete: "Can we trust this regression model to predict cycle life within ±8% when we deploy it on the new cell chemistry?" That sentence already contains the raw material of a credibility requirement — a decision context, a quantity of interest, a population, and a tolerance. The engineering work is to make each of those elements explicit, testable, and traceable to evidence, rather than collapsing them into a single accuracy number.
This distinction matters because performance reporting and credibility are not the same thing. A model can report R² = 0.97 on a held-out set and still be non-credible for the stakeholder's decision, because the held-out set may not represent the deployment population, the metric may not reflect the tolerance that matters, or no evidence may exist that the model behaves acceptably outside its training envelope. Credibility is a claim about fitness for a specific use, supported by a structured body of evidence. Performance metrics are one input to that evidence, not the conclusion.
Anatomy of a Credibility Requirement
A well-formed credibility requirement for a regression model has six parts. Writing them down as separate fields prevents the common failure of "we validated it, it's fine" with no auditable link between the stakeholder's decision and the evidence produced.
| Field | Meaning | Example (cycle-life regression) |
|---|---|---|
| Decision context | The decision the model informs and the cost of being wrong | Approve a 500-cycle warranty extension for a new cell batch |
| Quantity of interest (QoI) | The specific output the decision depends on | Predicted cycles to 80% capacity retention |
| Population & envelope | Inputs the model will see in deployment | Cells with 2.9–3.2 V nominal, 0.5–1.5 C discharge, 15–35 °C |
| Acceptance threshold | Numeric pass/fail criterion on a defined metric | |relative error| ≤ 8% for ≥ 90% of validation cells; max error ≤ 15% |
| Validation metric | How error is measured and aggregated | Relative error per cell; 90th percentile and maximum over the validation set |
| Evidence needs | What artifacts must exist to support the claim | Independent validation set, extrapolation test, sensitivity study, documented assumptions |
The acceptance threshold and the validation metric must be chosen together. "≤ 8% error" is meaningless until you specify whether that is a mean, a median, a 90th percentile, or a per-cell bound — each implies a different test and a different evidence burden. For a warranty decision, a tail metric (90th percentile plus a maximum) is usually more defensible than a mean, because a single badly under-predicted cell can trigger a costly field failure even if the average error is small.
Worked Example: Turning the Question into Requirements
Suppose the stakeholder's question is the one above, and the model is a gradient-boosted regressor trained on 1,800 historical cells. The following requirement set is a teaching example — the numbers are illustrative and must be replaced with values agreed by the stakeholder and the model owner.
- QoI and units. Cycles to 80% capacity retention, integer cycles, predicted per cell.
- Deployment envelope. Nominal voltage 2.9–3.2 V, discharge rate 0.5–1.5 C, temperature 15–35 °C. Inputs outside this envelope are flagged as out-of-distribution and excluded from the credibility claim.
- Acceptance thresholds. On an independent validation set of at least 200 cells drawn from the deployment envelope: 90th-percentile absolute relative error ≤ 8%, and maximum absolute relative error ≤ 15%. No cell may be silently dropped; exclusions must be reported with reasons.
- Validation metric definition. Relative error
e_i = (ŷ_i − y_i) / y_i, withy_ithe measured cycle life. Report the full error distribution, not only the aggregate. - Extrapolation evidence. A held-out slice at the envelope edges (1.5 C and 35 °C) must meet the same thresholds, or the claim is restricted to the interior of the envelope.
- Sensitivity evidence. A documented study showing how the 90th-percentile error changes when the two most influential input features are perturbed by ±5%, to bound the effect of measurement noise.
- Assumption register. Explicit list of assumptions (e.g., cycle life measured under a fixed charge protocol) with the consequence if each is violated.
Notice that items 5–7 are evidence needs, not performance numbers. They exist because the stakeholder's decision depends on behavior at the edges of the envelope and on the stability of the prediction — conditions a single held-out R² cannot certify. This is the practical difference between reporting performance and establishing credibility.
How the Requirements Chain to Evidence
The diagram below shows how a single stakeholder question decomposes into requirements, and how each requirement maps to a specific evidence artifact and a pass/fail judgment. The key structural point is that the acceptance thresholds sit on the evidence side, not the question side — the question supplies intent, the requirements supply testability, and the evidence supplies the verdict.
Common Failure Modes and How to Catch Them
- Metric–decision mismatch. The requirement says "mean error ≤ 8%" but the decision is a warranty bound. A mean hides tail risk; switch to a percentile-plus-maximum metric and re-derive the threshold with the stakeholder.
- Envelope creep. The validation set was drawn from the same narrow conditions as training, but deployment spans wider. Symptom: excellent in-envelope error, no evidence at the edges. Fix: hold out an edge slice and report it separately.
- Silent exclusions. Cells that fail to converge or look anomalous are dropped before scoring. This inflates apparent accuracy. Require every exclusion to be logged with a reason and counted in the report.
- Threshold without a metric definition. "≤ 8%" with no statement of aggregation is not evaluable. Pair every threshold with its metric formula and aggregation rule.
- Evidence gap disguised as a pass. A requirement with no corresponding artifact should be marked NOT EVALUATED, never PASS. The verdict column in the diagram exists precisely to make this visible.
Deliverable: Credibility Requirement Record
The following record is a fillable template for this case. Each row is one requirement; the evidence column names the artifact that will be produced, and the verdict column is completed only after that artifact exists.
| ID | Requirement | Metric / criterion | Evidence artifact | Verdict |
|---|---|---|---|---|
| R1 | QoI defined with units | cycles to 80% retention | Model card, QoI statement | — |
| R2 | Deployment envelope stated | 2.9–3.2 V, 0.5–1.5 C, 15–35 °C | Envelope definition + OOD flag rule | — |
| R3 | Tail accuracy in envelope | P90 |rel. err| ≤ 8%; max ≤ 15% | Validation report, per-cell table | — |
| R4 | Metric fully specified | e_i = (ŷ_i − y_i)/y_i; P90 and max | Metric definition section | — |
| R5 | Edge behavior demonstrated | same thresholds on edge slice | Edge-slice results | — |
| R6 | Robustness to input noise | P90 error change under ±5% perturbation | Sensitivity curves | — |
| R7 | Assumptions documented | each with consequence if violated | Signed assumption register | — |
Complete the verdict column only by inspecting the named artifact against the stated criterion. A row with no artifact is NOT EVALUATED, and the overall credibility claim must be scoped to exclude it. This record is the traceable link between the stakeholder's question and the evidence — the artifact that distinguishes a credibility argument from a performance report.