1. Course overview
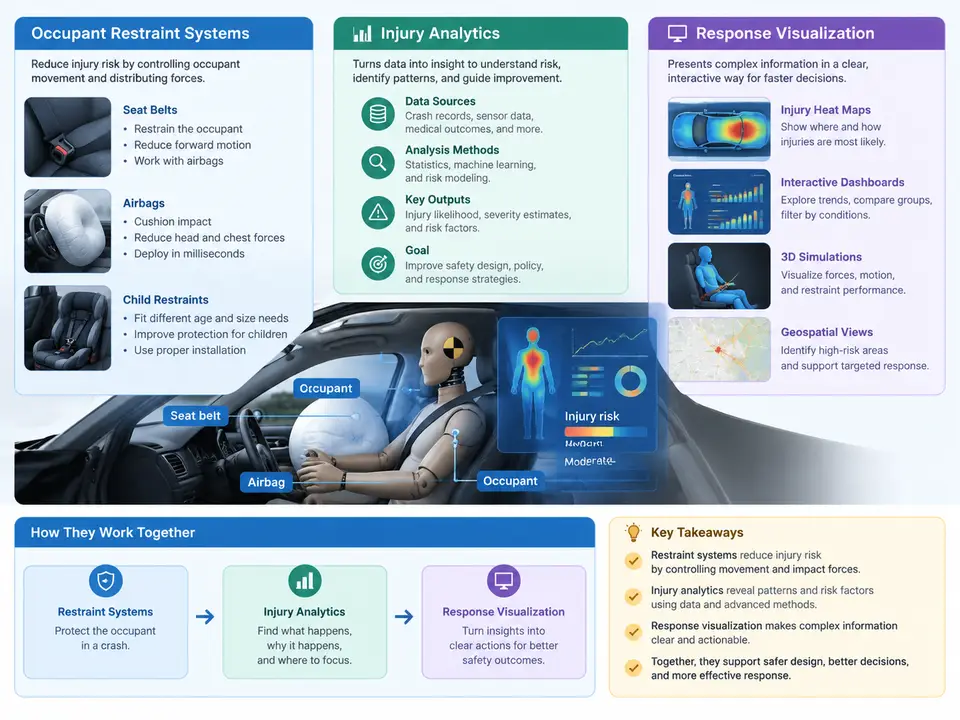
This course addresses a question that sits at the intersection of vehicle safety engineering, biomechanics, and data science: when a crash occurs, what exactly happens between the occupant and the restraint system, how do we quantify the resulting injury risk, and how do we turn that quantification into something engineers and decision-makers can actually see and act on? The three pillars named in the title — occupant restraint systems, injury analytics, and response visualization — are not independent topics. They form a chain in which the restraint hardware defines the mechanical boundary conditions, the injury metrics interpret the occupant's kinematic and kinetic response within those boundaries, and the visualization layer compresses high-dimensional time-series and spatial data into representations that support diagnosis and design iteration.
What the restraint system actually is
An occupant restraint system is best understood as a coordinated set of energy-management devices rather than a collection of separate parts. In a modern frontal impact configuration, the primary elements are the three-point seat belt with its retractor, load limiter, and pretensioner; the frontal airbag module; the seat structure and its deformation characteristics; and increasingly, the reversible or pyrotechnic systems that adapt to occupant size and position. Each element has a distinct force–time signature, and the occupant's injury outcome depends on how those signatures superimpose.
Consider the belt force limiter as a concrete example. A typical load limiter might be designed to cap belt force at approximately 3.5–4.5 kN during the ride-down phase. If the limit is set too high, the chest experiences excessive compression; if set too low, the occupant's forward excursion increases and the risk of contact with the interior or of submarining rises. The pretensioner, firing within roughly 10–20 ms of the crash pulse, removes slack before the occupant loads the belt. The airbag, deploying over approximately 20–40 ms, provides a compliant surface that distributes head and chest loading. These are not independent tuning knobs — changing the load limiter changes the excursion, which changes the airbag contact geometry, which changes the head kinematics.
From physical response to injury metrics
Injury analytics begins with measurement. The physical quantities of interest are typically accelerations measured at the vehicle structure and at the occupant (head, chest, pelvis), belt forces, and — in dummy-based testing — displacements and deflections. From these signals we derive injury criteria. The most familiar are HIC (Head Injury Criterion), computed from the resultant head acceleration over a defined time window; chest deflection and the associated compression criteria; and the Viscous Criterion, which captures the rate-dependent behavior of soft tissue. Nij and other neck criteria appear in more specialized analyses.
The analytical work is not merely plugging numbers into formulas. It requires decisions about filtering — CFC 1000 for HIC, CFC 180 or 600 for chest channels depending on the standard being applied — about time-window selection, and about how to handle signals that are noisy or truncated. A HIC value computed from an unfiltered channel, or from a window that clips the peak, is a number without meaning. This course treats signal conditioning as part of the analytics, not as a preprocessing afterthought.
Why visualization is a technical discipline here
Crash data is inherently multi-channel and time-aligned. A single frontal test may produce dozens of channels sampled at 10 kHz or higher, plus video, plus occupant kinematics from simulation. Visualization in this context has three distinct jobs. The first is temporal: overlaying belt force, chest acceleration, and head acceleration on a common time axis so that the phase relationships — when the pretensioner fires relative to peak belt force, when the airbag membrane is loaded relative to head contact — become immediately legible. The second is spatial: showing occupant position and trajectory relative to the restraint envelope, which is where contact and clearance problems reveal themselves. The third is comparative: placing baseline and modified configurations side by side so that a design change's effect on the injury metrics can be attributed rather than merely observed.
The SVG below maps the full technical chain from crash pulse to decision, showing where each analytical stage sits and what flows between them.
Scope boundaries and technical context
It is worth being explicit about what this course covers and what it does not. The scope is passenger-vehicle occupant restraint in frontal and oblique impact, with the analytical methods applicable to both physical testing and CAE simulation. The course does not attempt to cover pedestrian protection, child restraint certification in full, or the regulatory approval process itself, although the metrics discussed are the same ones those processes rely on. Where standards are referenced — FMVSS 208, ECE R94/R95, or the C-NCAP and Euro NCAP protocols — they are used as the source of metric definitions and test conditions, not as a compliance tutorial.
The technical context matters because the same injury metric can mean different things depending on how it was produced. A HIC value from a sled test with a rigid seat differs from one obtained in a full-vehicle crash where the seat deforms and the occupant's posture shifts. A simulation-derived chest deflection depends on the fidelity of the dummy model and the belt routing. Throughout the course, we will keep the provenance of each number visible, because an injury metric without its measurement context is not actionable.
How the three pillars connect in practice
A representative workflow makes the connection concrete. Suppose a frontal sled configuration produces a chest compression of 32% and a HIC of 620, both within typical acceptance ranges, but the head excursion is marginal. The analyst overlays the belt force and head acceleration time histories and observes that peak head acceleration occurs roughly 15 ms after peak belt force — the head is arriving at the airbag late, after the bag has already begun to deflate. The visualization makes the phase mismatch visible; the injury analytics quantify it; the restraint system understanding explains it. The design response might be a faster-deploying inflator or a revised pretensioner profile, and the loop closes with a new test or simulation.
This is the pattern the course will develop across its chapters: read the response, quantify the injury, visualize the relationship, and attribute the cause before changing a parameter. The first step in any of these analyses is establishing a clean, time-aligned, properly filtered dataset — and that is where the technical work begins.