1. NCAP rating fundamentals
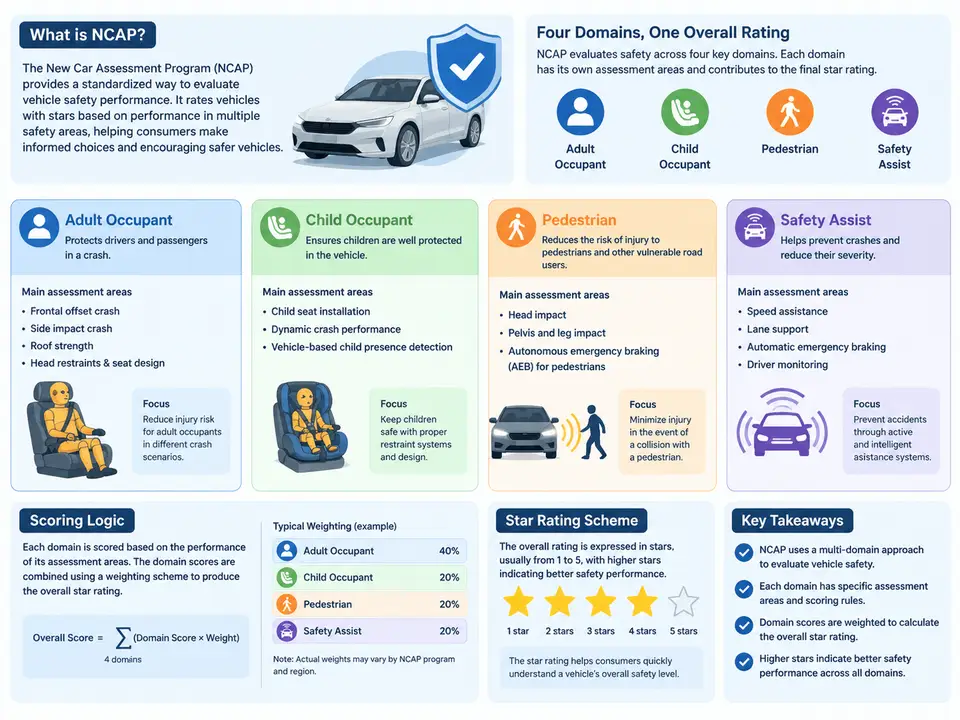
Before any spreadsheet formula or Python script can be trusted, the underlying rating model must be understood precisely. New Car Assessment Programmes (NCAPs) — Euro NCAP, ASEAN NCAP, Latin NCAP, Global NCAP, and others — publish star ratings that look deceptively simple: one to five stars. Behind each star sits a weighted, multi-domain scoring pipeline with domain-specific tests, normalization rules, caps, and penalty conditions. Automation fails most often not because the code is wrong, but because the scoring semantics were misread. This chapter establishes the reference model that every later calculator component will implement.
The star rating as a compressed output
A star rating is a discrete presentation of a continuous overall score. Each programme defines its own maximum overall score (commonly expressed as a percentage or a point total), then maps score bands to stars. A typical band structure — used here as an illustrative example, not a claim about any specific current protocol — might read: ≥ 80% overall → 5 stars; 65–79.99% → 4 stars; 50–64.99% → 3 stars; 35–49.99% → 2 stars; below 35% → 1 star. The exact thresholds, and whether a domain minimum is also required, are protocol-version-specific and must be stored as data, never hard-coded in logic.
Two properties of this mapping matter for automation. First, band boundaries are usually inclusive on the lower edge and exclusive on the upper edge, so a score of exactly 65.00% must land deterministically in one band. Second, many programmes apply caps: a vehicle may earn a high weighted score yet be limited to four stars if a mandatory safety assist technology is missing, or to a lower band if a domain score falls below a floor. A calculator that only computes the weighted sum will silently over-rate such vehicles.
Assessment domains and their internal structure
Modern NCAP schemes assess four principal domains, each with its own test catalogue and scoring scale:
- Adult Occupant Protection (AOP). Frontal offset and full-width impacts, side barrier and side pole impacts, whiplash tests, and — in recent protocols — far-side and post-crash rescue criteria. Scores derive from dummy injury readings (HIC, chest deflection, femur loads) mapped through injury-risk curves to points.
- Child Occupant Protection (COP). Combines dynamic crash performance of child restraint systems (CRS) in frontal and side impacts with static assessment of CRS installation, vehicle-based child presence detection, and the clarity of ISOFIX/i-Size labelling.
- Vulnerable Road User (VRU) / Pedestrian Protection. Head and leg impactor tests against the bonnet and bumper, plus, in newer protocols, active bonnet and autonomous emergency braking (AEB) performance for pedestrians and cyclists.
- Safety Assist (SA). Performance-based scoring of AEB (car-to-car, VRU), lane support systems, speed assistance, occupant status monitoring, and — increasingly — driver monitoring. SA scoring is often performance-graded rather than pass/fail.
Each domain produces a domain score, usually normalized to a percentage of that domain's maximum. The overall score is then a weighted combination of domain percentages. Weights differ by programme and protocol year; a representative illustrative split might be AOP 40%, COP 20%, VRU 20%, SA 20%. These weights are configuration inputs, not constants.
From test readings to points: the scoring chain
Within a domain, scoring follows a consistent chain: raw measurement → criterion score → test score → domain score → weighted overall score → star band. Consider an illustrative frontal offset test. A head injury criterion reading of 650 might map to full points, 1000 to zero points, with linear interpolation between. Multiple body regions are scored, the lowest-performing region often dominating through a modifier, and the test result is capped at the maximum for that test. Aggregating across tests yields the domain total.
Reading the scoring pipeline visually
The diagram above shows the canonical pipeline. Note the ordering: caps are evaluated after the weighted score is computed, and they can only reduce the star band, never raise it. In code, this becomes a two-stage function — compute_overall_score() followed by apply_caps() — which keeps the cap logic independently testable.
A worked illustrative calculation
Using the example figures embedded in the diagram, suppose a vehicle achieves AOP 34.5/40, COP 16.0/20, VRU 15.0/20, and SA 14.0/20. Normalizing each to a percentage and applying the illustrative weights:
aop_pct = 34.5 / 40 * 100   # 86.25%
cop_pct = 16.0 / 20 * 100   # 80.00%
vru_pct = 15.0 / 20 * 100   # 75.00%
sa_pct  = 14.0 / 20 * 100   # 70.00%

overall = (aop_pct * 0.40 + cop_pct * 0.20 +
           vru_pct * 0.20 + sa_pct  * 0.20)
# = 34.50 + 16.00 + 15.00 + 14.00 = 79.50%
An overall score of 79.50% falls in the 65–79.99% band, yielding 4 stars. If the protocol additionally required a minimum SA percentage of 75% for a 5-star outcome, the vehicle would be capped at 4 stars regardless — and here it would not have reached 5 stars anyway. The important engineering point is that the calculator must evaluate both the band and the cap, and report which constraint determined the final result. A rating tool that returns only "4 stars" is diagnostically useless; one that returns "4 stars — band-limited (79.50% < 80%)" is auditable.
What this means for the automation design
Three consequences follow directly. First, the calculator needs a configuration layer holding weights, band thresholds, caps, and per-test interpolation tables, keyed by programme and protocol version. Second, it needs a traceable intermediate representation: every domain score, every percentage, and every applied cap should be retained so results can be reviewed against the official report. Third, rounding must be explicit. NCAP reports typically round to one or two decimals at defined stages; rounding at the wrong stage can shift a score across a band boundary. Define the rounding rule once — for example, round half-up to two decimals only at final presentation — and apply it identically in Excel and Python so both implementations agree to the last digit.
With this reference model in place — domains, normalization, weighting, banding, and caps — the remaining chapters can treat the rating logic as a well-defined specification. The next design question is how to represent that specification as data so that a single calculation engine can serve multiple programmes without code changes.