1. Multi-iteration CAE comparison and ranki
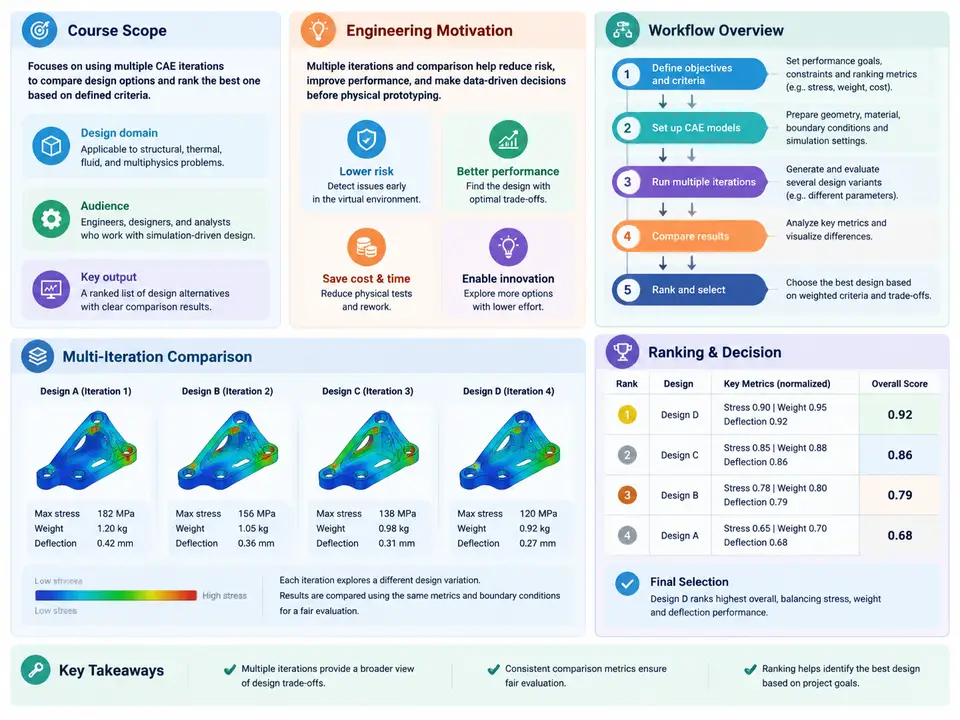
In a typical structural development program, a single CAE run is rarely the end of the story. Design engineers submit an initial concept, run a baseline simulation, observe that peak stress exceeds the allowable, thicken a rib, re-mesh, and run again. Within a week the project folder may contain a dozen solver decks, each differing by a few millimetres of geometry, a different material card, or a revised load case. The engineering question is no longer "does this design pass?" but "which of these candidate designs is best, and by what margin?" Multi-iteration CAE comparison and ranking is the discipline that answers that question systematically: it treats every simulation as a data point in a design space, normalizes results across iterations, and produces a defensible ordering of candidates against explicit, weighted criteria.
This chapter establishes the scope of the course, explains why ad-hoc comparison fails in practice, and lays out the end-to-end workflow that the remaining chapters will develop in detail. The emphasis throughout is on reproducibility: every comparison must be traceable to a defined baseline, a consistent result extraction method, and a documented scoring scheme.
Why single-run verification is not enough
Classical CAE verification asks a binary question against a specification: is margin positive? That framing works when there is one design and one requirement. Real programs, however, are multi-objective. A lighter bracket may raise stress; a stiffer housing may add mass and shift a natural frequency into a resonance band; a cheaper material may reduce fatigue life. When five or twenty variants exist, engineers naturally compare them — but usually informally, by opening result files side by side and eyeballing contour plots. This informal comparison has three recurring failure modes:
- Inconsistent extraction. Iteration 3 reports von Mises stress at a node 4 mm from the fillet; iteration 7 reports the element-average value over a patch. The numbers differ by 15% for reasons unrelated to design quality.
- Baseline drift. Mesh density, contact stiffness, and solver tolerances change between runs, so part of every delta is numerical noise rather than design change.
- Unstated weighting. The engineer's mental trade-off between mass, stress, and cost is never written down, so the "best" design cannot be defended in a design review or reproduced by a colleague.
Ranking methodology addresses each of these: it fixes extraction rules, quantifies numerical uncertainty, and makes the objective function explicit and auditable.
Scope of the course
The course covers comparison and ranking for deterministic, simulation-based design candidates — that is, a finite set of design iterations evaluated with the same CAE toolchain, where each iteration is defined by a documented set of input changes. It spans the full chain from iteration bookkeeping through result normalization, multi-criteria scoring, sensitivity checks, and final recommendation. It does not attempt to replace formal optimization (topology or gradient-based); rather, it provides the comparison layer that sits between a design-of-experiments campaign and a go/no-go decision. Probabilistic methods are treated only insofar as they affect ranking confidence.
The comparison workflow at a glance
The workflow has five stages, shown in the figure below. Each stage produces an artifact that the next stage consumes, so the chain is auditable end to end.
Stage 1 — Iteration bookkeeping. Every candidate receives a stable identifier (for example BRK-014), a parent reference, and a change log entry stating exactly what differs from the baseline: geometry revision, material card, load case, or solver setting. The baseline itself is frozen — its deck, mesh, and extraction script are archived and never edited. Without this discipline, later deltas are meaningless.
Stage 2 — Result extraction. A fixed set of probes is defined once and applied to every iteration: named node sets for peak stress, a defined path for deflection, a modal order for frequency, and a mass property from the solver's summary. Extraction is scripted rather than manual, so the same averaging rule (for example, nodal unaveraged von Mises at a defined set) is applied identically across all runs.
Stage 3 — Normalization and noise check. Raw metrics are converted to comparable form. A common approach is to express each metric as a ratio to its requirement or to the baseline value, so that stress margin, mass ratio, and frequency ratio share a dimensionless scale. In parallel, a numerical noise floor is estimated — typically by re-running one iteration with a refined mesh and recording the change in each metric. Any inter-iteration delta smaller than this floor is treated as indistinguishable from numerical variation and flagged rather than ranked.
Stage 4 — Multi-criteria scoring. Each normalized metric is mapped to a utility score through a defined curve (for example, linear between an acceptable and a target threshold, clamped outside). Weights reflecting program priorities are assigned and documented. The weighted sum, or a Pareto front when weights are contested, produces the ranking.
Stage 5 — Sensitivity and decision. Weights are perturbed to test whether the top-ranked design is robust to reasonable changes in priority. If the leader changes under a ±20% weight sweep, the shortlist is reported as a tie with a trade-off plot rather than a single winner. The final artifact is a decision record: ranked table, sensitivity result, and the rationale for the recommendation.
A worked illustration of the data model
Consider a bracket program with four iterations. The table below shows the kind of register the workflow produces. Values are illustrative and chosen for teaching, not measured results.
| Iteration | Change vs. baseline | Peak von Mises (MPa) | Mass (kg) | 1st mode (Hz) | Noise floor |
|---|---|---|---|---|---|
| BRK-001 (baseline) | — | 212 | 1.84 | 146 | ±3 MPa |
| BRK-002 | Rib thickness +1.5 mm | 178 | 1.97 | 151 | ±3 MPa |
| BRK-003 | Fillet radius 6→10 mm | 191 | 1.86 | 147 | ±3 MPa |
| BRK-004 | Material 6061-T6→7075-T6 | 149 | 1.84 | 158 | ±3 MPa |
With an allowable of 200 MPa, BRK-001 fails and BRK-003 passes only marginally — a 9 MPa margin that is three times the noise floor, so the pass is credible but thin. BRK-002 and BRK-004 both pass comfortably, but they trade mass against stress differently: BRK-002 adds 7% mass, while BRK-004 adds cost through material. A ranking that weights mass at 0.4, stress margin at 0.4, and cost at 0.2 would place BRK-004 first; shifting mass weight to 0.6 could promote BRK-003. That sensitivity is exactly what Stage 5 exists to expose.
What "best" means, and what it does not
Ranking produces a conditional recommendation: best under the stated criteria, weights, and noise assumptions. It is not a claim of global optimality, and it does not replace engineering judgement on unmodeled effects such as manufacturing variation, corrosion, or assembly loads. The value of the workflow is that it makes the conditionality visible — a reviewer can see the weights, challenge them, and re-rank without re-running the solver. That transparency, more than the arithmetic, is what makes multi-iteration comparison defensible in a design review.
The remaining chapters build each stage in turn: constructing the iteration register and change log, scripting robust result extraction, establishing noise floors through mesh sensitivity, designing utility curves and weight sets, and finally producing the ranked decision record with its sensitivity analysis. By the end, you will be able to take a folder of solver decks and turn it into a ranked, auditable shortlist that survives technical review.