1. Crash analytics in modern software syste
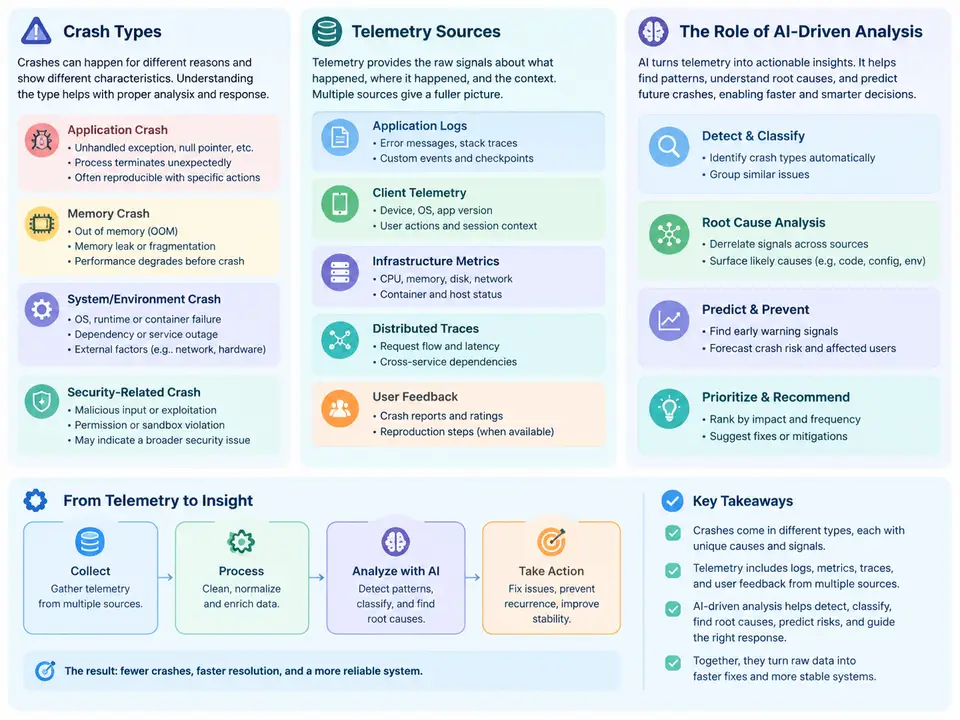
Crash analytics is the discipline of turning raw failure signals emitted by production software into actionable engineering knowledge. In a modern distributed system, a single user-visible crash rarely has a single cause: a null dereference in a mobile client may be triggered by a malformed payload from an API gateway, which in turn was produced by a schema regression in a backend service. Crash analytics exists to reconstruct that causal chain from telemetry, quantify its impact, and route it to the team that can fix it. This chapter establishes the vocabulary and data foundations that the rest of the course builds on: what kinds of crashes occur, where the evidence comes from, and why AI-driven analysis has become the default approach at scale.
Crash Types and Their Diagnostic Signatures
Not all crashes are alike, and the distinction matters because each type produces different telemetry and demands different analysis techniques. A practical taxonomy for analytics purposes groups failures by where the fault is detected and how the process terminates.
- Unhandled exceptions and fatal signals. In managed runtimes (JVM, .NET, Python, JavaScript), an uncaught exception terminates the execution context and typically yields a structured stack trace. In native code, segmentation faults, aborts, and illegal instructions arrive as POSIX signals (SIGSEGV, SIGABRT, SIGILL) and require symbolication against debug information to become readable.
- Out-of-memory (OOM) terminations. The kernel OOM killer, a runtime heap-limit breach, or a container memory cgroup limit produces a kill event rather than a conventional stack trace. The diagnostic evidence is a memory timeline plus the allocation context, not a call stack.
- Watchdog and ANR timeouts. Mobile platforms and embedded systems terminate processes that block the main thread too long — Android's ANR (Application Not Responding) and iOS watchdog terminations are canonical examples. The signature is a main-thread stack sampled at timeout, which is why these are often grouped with hang analytics.
- Native crashes inside third-party SDKs. A large share of mobile crashes originate in advertising, analytics, or payment SDKs. Attribution requires mapping addresses back to the correct binary and build ID, which is a symbolication and provenance problem rather than a logic problem.
- Silent or graceful degradations. Some failures never crash the process — a coroutine dies, a worker pool starves, a circuit breaker opens permanently. These surface only through health metrics and are increasingly folded into crash analytics because their user impact is comparable.
The analytical consequence is that a crash record must carry a type discriminator and type-specific payload. A pipeline that assumes every crash has a stack trace will silently drop OOM kills and watchdog terminations — often the categories with the highest severity.
Telemetry Sources and What Each One Contributes
Crash evidence arrives through several independent channels. Treating them as a single stream loses the ability to cross-validate, so mature platforms keep them distinct and join them at analysis time.
| Source | Typical content | Primary analytical value |
|---|---|---|
| Crash reporter SDK | Stack trace, exception type, thread state, device/app metadata, breadcrumbs | Fault localization and grouping |
| Minidumps / core dumps | Memory image, register state, loaded module list | Native symbolication and register-level diagnosis |
| Structured logs | Timestamped events with correlation IDs | Reconstructing the sequence preceding the crash |
| Distributed traces | Span trees across services with latency and status | Identifying the upstream trigger in service meshes |
| Metrics and health probes | Memory, CPU, GC pauses, restart counts, error rates | Detecting OOM, watchdog, and degradation patterns |
| Release and build metadata | Version, commit SHA, mapping files, feature flags | Symbolication, regression attribution, cohort slicing |
Two engineering details dominate data quality. First, symbolication: native addresses are meaningless without the matching debug symbols and build ID, and mismatched mapping files produce confidently wrong stack traces. Second, sampling and rate limiting: a crash loop affecting 200,000 devices can overwhelm ingestion, so SDKs apply per-signature quotas. A well-designed sampler keeps the first N occurrences of each new signature at full fidelity and downsamples repeats — preserving discovery while controlling cost.
A representative crash event, reduced to its analytically essential fields, looks like this:
{
  "event_id": "c7f3a1e2-...",
  "timestamp": "2024-11-08T14:22:07.431Z",
  "crash_type": "unhandled_exception",
  "platform": "android",
  "app_version": "4.12.0 (build 4120091)",
  "exception": {
    "class": "java.lang.NullPointerException",
    "message": "Attempt to invoke virtual method on null reference",
    "top_frame": "com.acme.checkout.CartPresenter.recalculate(CartPresenter.kt:118)"
  },
  "device": { "model": "Pixel 7", "os": "Android 14", "ram_mb": 8192 },
  "breadcrumbs": [
    { "t": "-2.1s", "event": "screen_view", "name": "CartScreen" },
    { "t": "-0.4s", "event": "network_response", "status": 200, "schema": "cart.v3" }
  ],
  "release_channel": "stable",
  "feature_flags": { "new_pricing_engine": true }
}
Note the breadcrumb showing a cart.v3 response immediately before the fault, and the enabled new_pricing_engine flag. Neither proves causation, but both are exactly the kind of correlated signal that AI-driven grouping exploits.
Why AI-Driven Analysis Replaces Rule-Based Triage
Classical crash platforms grouped events by hashing the top stack frames. That approach breaks down for three reasons: stack traces vary across compiler versions and inlining decisions; obfuscated or minified frames collide; and the same root cause can manifest through different call paths depending on device and timing. The result is either over-grouping (unrelated bugs merged, obscuring ownership) or under-grouping (one bug split into hundreds of signatures, destroying impact estimates).
AI-driven analysis addresses this at several layers. Similarity-based grouping embeds stack frames, exception messages, and breadcrumb sequences into vectors and clusters them, so that a null dereference reached via two different UI paths lands in one issue. Impact scoring models crash-free-session rate per cohort and ranks issues by estimated affected users rather than raw event count, which prevents a noisy low-severity crash from outranking a rare but fatal one. Regression attribution correlates the first appearance of a signature with release rollouts and feature-flag changes, producing a candidate culprit version automatically. Root-cause suggestion retrieves similar historical issues and their fixes, giving an on-call engineer a starting hypothesis within seconds.
The End-to-End Analytics Path
The diagram below traces a crash from emission to engineering action, showing where each telemetry source enters and which analytical stage consumes it.
Two properties of this pipeline deserve emphasis. First, symbolication is a hard gate: if build IDs and mapping files do not match, every downstream stage operates on corrupted input, and the AI layer will confidently cluster garbage. Second, the dashed feedback path is what makes the system improve over time — when an engineer marks an issue as fixed and the crash-free rate recovers, that outcome becomes labeled training data for impact and grouping models.
Establishing a Baseline Before Adding Intelligence
Before any model is introduced, verify that the raw pipeline is trustworthy. A practical acceptance check on a staging build is to inject a known fault — for example, force a NullPointerException in a debug-only code path — and confirm that the event arrives with a symbolicated top frame, correct app_version, and intact breadcrumbs. Typical failure symptoms and their causes:
- Stack frames show raw hex addresses. The uploaded mapping file does not match the build ID; check that the symbol upload step runs in the same CI job that produces the artifact.
- Crash count far below device count during a crash loop. Per-signature sampling is discarding repeats; confirm the first-N policy is active and that the signature key is stable.
- OOM events missing entirely. The SDK only hooks exception handlers; add a termination-reason reader for the platform (for example, Android's
ApplicationExitInfo) to capture kills that bypass the handler. - Breadcrumbs empty. The breadcrumb buffer is being cleared on backgrounding, or the crash occurs before the first screen view; verify buffer persistence across process death.
Once these checks pass, the telemetry is fit to feed the analytical stages, and the AI layer can be evaluated against a known-good baseline rather than against its own output. That baseline discipline is the thread running through the remainder of this course: every model, threshold, and routing rule introduced later is only as good as the crash records it consumes.