1. Injury metrics and CAE performance KPIs
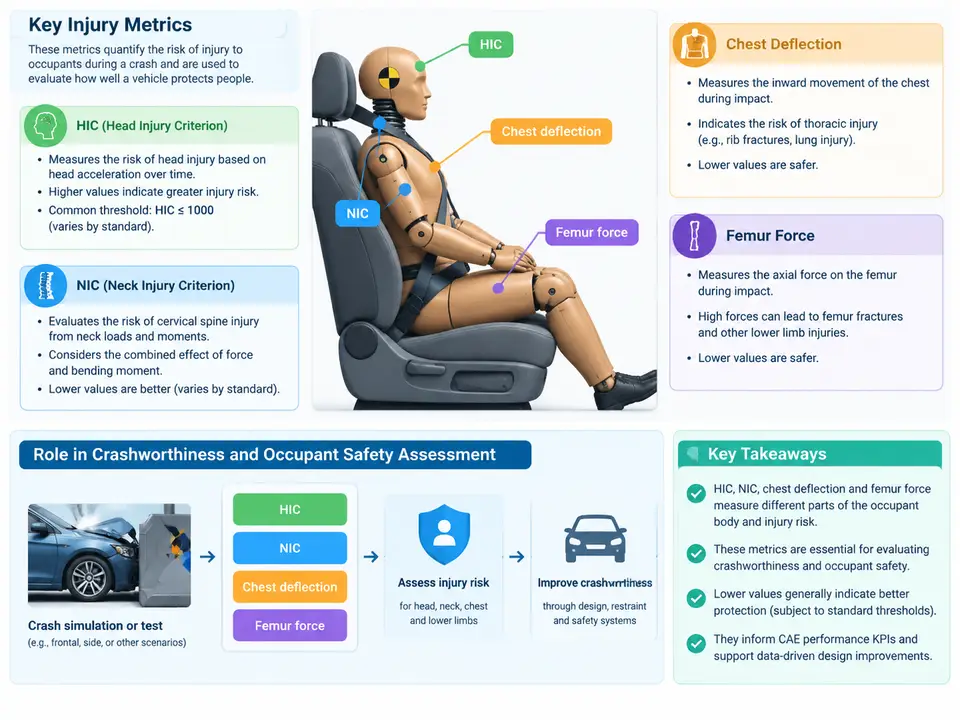
Crashworthiness engineering is fundamentally a measurement discipline. A vehicle body can absorb enormous energy and still fail an occupant-safety target if the deceleration pulse delivered to the head, neck, or chest exceeds a biomechanical tolerance. The injury criteria — HIC, NIC, chest deflection, and femur force — are the calibrated bridges between the physical crash event and the physiological damage it may cause. In a Power BI context, these metrics are not merely numbers to be averaged; they are the semantic foundation on which every KPI, threshold comparison, and pass/fail visual is built. Getting their definitions, units, and sign conventions right at the data-model level determines whether the entire dashboard is trustworthy.
What Each Criterion Actually Measures
HIC (Head Injury Criterion) quantifies the likelihood of head injury from translational acceleration. It is computed over a sliding time window and takes the maximum value found anywhere in the acceleration trace:
HIC = max over t1,t2 of [ (t2 - t1) * ( (1/(t2-t1)) * ∫ a(t) dt )^2.5 ]
subject to t2 - t1 ≤ 15 ms (HIC15) or 36 ms (HIC36)
a(t) expressed in g (multiples of 9.81 m/s²)
The 2.5 exponent makes HIC highly sensitive to short, sharp spikes — a brief 200 g pulse can dominate a longer, gentler one. This is why HIC is reported as a single scalar per impact event, and why the time window (HIC15 vs. HIC36) must be stored as an explicit attribute rather than assumed. In CAE post-processing, HIC is typically extracted from a head CG accelerometer channel in the occupant restraint model; in Power BI, the window variant becomes a dimension so that HIC15 and HIC36 results never get silently mixed in an aggregate.
NIC (Neck Injury Criterion) addresses a different failure mode: the combined axial load and bending moment on the cervical spine, most relevant in rear-impact and whiplash scenarios. It is expressed as a dimensionless index relative to a critical intercept value, and it is direction-sensitive — tension-compression and flexion-extension produce different NIC components. Unlike HIC, NIC is not a single integral but a normalized resultant, so its sign and reference frame matter. A negative NIC in a dataset usually indicates a compression-dominant event, not a data error.
Chest deflection measures the physical inward displacement of the sternum relative to the spine, in millimetres, and is the primary predictor of rib fracture and thoracic organ injury. It is captured by a chest-band potentiometer or IR-TRACC in the dummy, and in CAE it is a relative displacement between two nodal sets. Because deflection is a signed quantity along the loading axis, the convention (positive = compression toward the spine) must be documented once and enforced everywhere — in the FE output request, in the ETL mapping, and in the DAX measure that flags exceedance.
Femur force is the axial compressive load transmitted through the femur, in kilonewtons, and indicates risk of femoral shaft fracture and, indirectly, pelvic loading. It is a peak-value metric: the maximum compressive force over the event, with tensile force tracked separately because the tolerance differs substantially.
Why These Four, and How They Interlock
These criteria are not independent checks; they form a body-region coverage map. HIC covers the head, NIC the neck, chest deflection the thorax, and femur force the lower extremities. A restraint system tuned to minimize HIC by softening the airbag may increase chest deflection by allowing deeper penetration; a stiffer seat structure may reduce femur force while raising NIC in a rear impact. The engineering value of the metric set is precisely this tension — it forces the designer to see trade-offs rather than optimize one number in isolation. In a Power BI model, this argues for a star schema in which each occupant body region is a dimension row, each metric a fact column, and the pass/fail threshold a slowly changing attribute keyed to the regulatory regime (FMVSS 208, Euro NCAP, or an internal target).
From CAE Output to a Governed KPI Model
The practical challenge is that CAE solvers emit these metrics in heterogeneous forms. A typical LS-DYNA or PAM-CRASH run produces ASCII or binary curves per channel; HIC and NIC are often computed by a post-processor (e.g., HyperGraph, Animator, or a Python script using the numpy trapezoidal rule), while chest deflection and femur force are read directly from transducer channels. Before any DAX is written, the ETL layer must normalize four things: units (g vs. m/s², mm vs. m, kN vs. N), sign conventions (especially chest deflection and NIC direction), time-window variants (HIC15 vs. HIC36), and event identity (which load case, which dummy position, which restraint configuration).
A workable Power BI model uses a fact table Fact_InjuryMetric with columns RunID, BodyRegion, MetricName, Value, Unit, Window, and Direction, plus a Dim_Threshold table keyed on MetricName and Regulation. The pass/fail measure then becomes a simple, auditable comparison rather than a hard-coded constant buried in a visual:
Metric Pass/Fail =
VAR CurrentValue = SELECTEDVALUE ( Fact_InjuryMetric[Value] )
VAR Limit = SELECTEDVALUE ( Dim_Threshold[Limit] )
VAR HigherIsWorse = SELECTEDVALUE ( Dim_Threshold[HigherIsWorse] )
RETURN
    IF (
        ISBLANK ( CurrentValue ) || ISBLANK ( Limit ),
        BLANK (),
        IF ( HigherIsWorse, CurrentValue <= Limit, CurrentValue >= Limit )
    )
This pattern keeps the threshold logic in one place. When a program switches from FMVSS 208 to an internal target, only Dim_Threshold changes; every visual, card, and conditional-format rule inherits the new limit automatically. It also makes the HigherIsWorse flag explicit — a subtle but critical distinction, because HIC, NIC, chest deflection, and femur force are all "higher is worse," whereas some derived KPIs (e.g., a safety margin ratio) are "higher is better." Encoding that direction as data rather than as a per-visual assumption prevents the classic dashboard error of green-flagging a failing result.
Reading the Numbers in Context
A single HIC value of 680 is meaningless without its window, its dummy, and its load case. The same is true of chest deflection: 42 mm may pass a 50th-percentile male target and fail a smaller-occupant or out-of-position scenario. The KPI layer must therefore carry the context dimensions — occupant size, seating position, impact type (frontal, side, rear), and restraint state — so that any aggregate is a deliberate slice rather than an accidental blend. In practice, the most useful first visual is not a single scorecard but a small-multiples matrix of body region against load case, with each cell showing the governing metric and its margin to threshold. That view immediately exposes the trade-off structure: a column of green HIC cells beside an amber chest-deflection column tells the engineer exactly where the restraint calibration is over-soft.
With these four criteria defined, unit-normalized, direction-tagged, and threshold-governed, the model is ready for the DAX layer that follows. The next design decision — how to compute sliding-window maxima and peak values efficiently in DAX without materializing every time step — depends entirely on the semantic correctness established here.